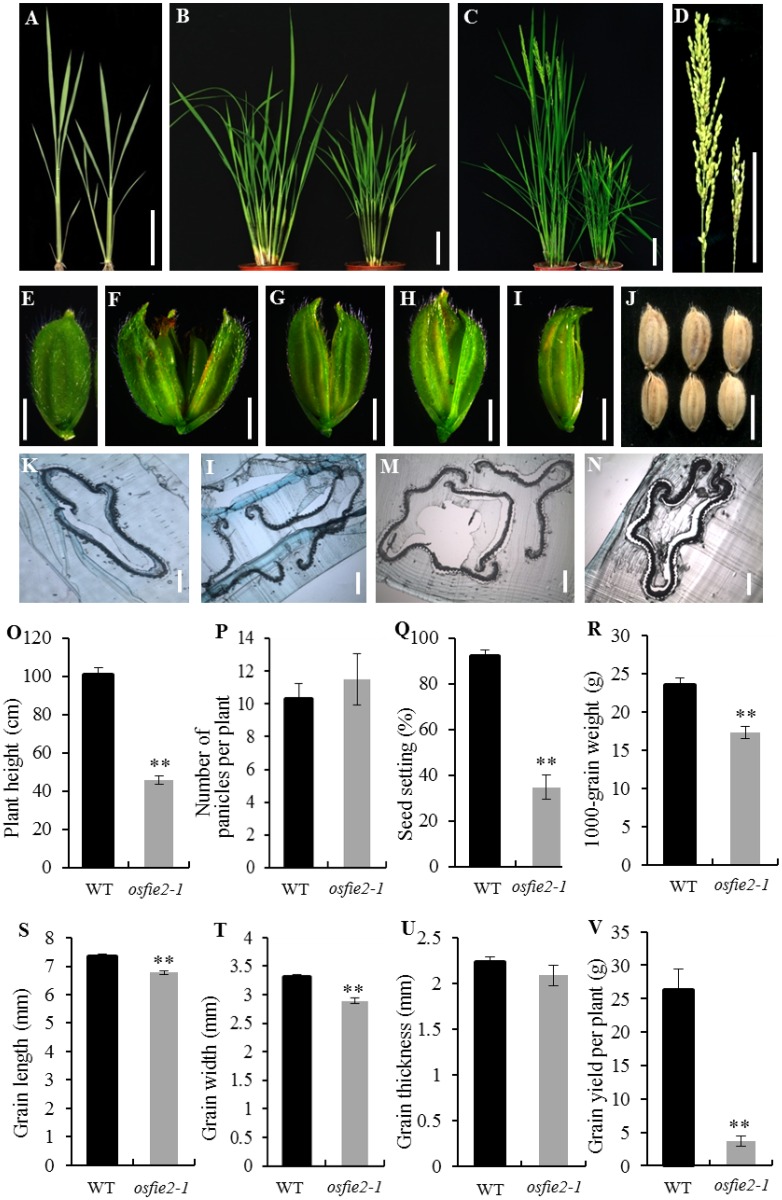
Fig 1. Characterization of the osfie2-1 mutant.
A, The phenotype of the wild-type (left) and osfie2-1 (right) during the seedling stage. B, Phenotype of wild-type and osfie2-1 during the tillering stage. C, Phenotype during the reproductive stage. D, Panicles of wild-type (left) and osfie2-1 (right). E, Spikelet of wild-type. F-I, Aberrant spikelet of osfie2-1. J, The grain phenotype of the wild-type (up) and osfie2-1 (down). K-N, semi-thin section of osfie2-1 and wild-type hulls. O-V, Quantification of the phenotypic analysis of wild-type and osfie2-1. Data are given as mean ± SD. Student’s t-test was used to generate the P values; * and ** indicate P<0.05 and P<0.01, respectively. Scale bars: 5 cm (A, B); 10 cm (C, D); 0.25 cm (E-I); 0.5 cm (J); 0.05 cm (K-N).

