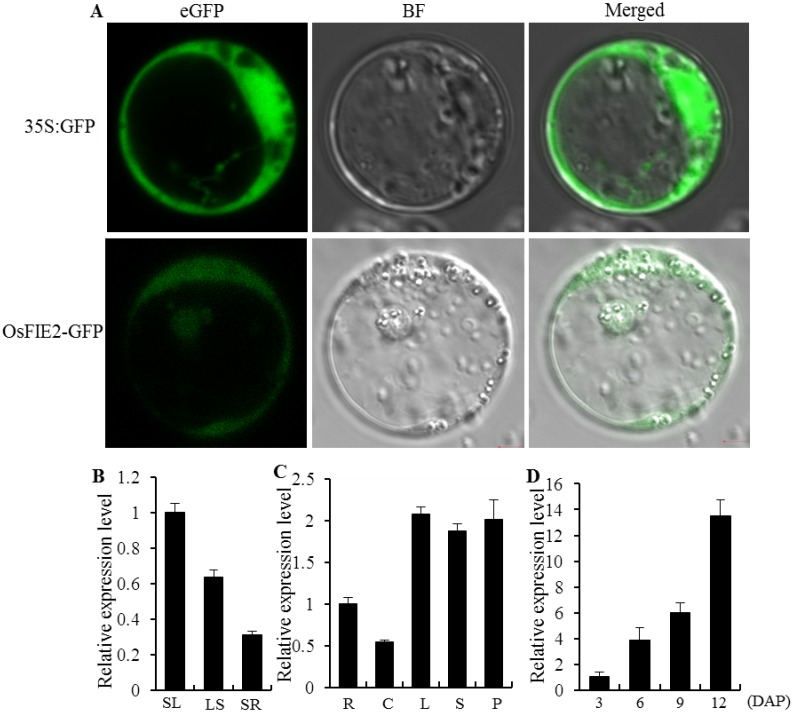
Fig 4. Subcellular localization and expression pattern of OsFIE2.
A, Subcellular localization of OsFIE2-GFP fusion protein in rice protoplasts. Confocal scanning images show localization in the nucleus and cytoplasm. 35S:GFP was used as a positive control. eGFP, enhanced green fluorescent protein. BF, bright-filed image. B, Expression pattern of OsFIE2 at the seedling stage. SL, seedling leaves; LS, leaf sheath; SR, seedling roots. C, Expression pattern of OsFIE2 at the heading stage. R, roots; C, culms; L, leaves; S, leaf sheaths; P, Panicles. D, Expression pattern of OsFIE2 in the endosperm at different stages (3, 6, 9, 12 days after pollination, DAP). Data are given as mean ± SD of three biological replicates.

