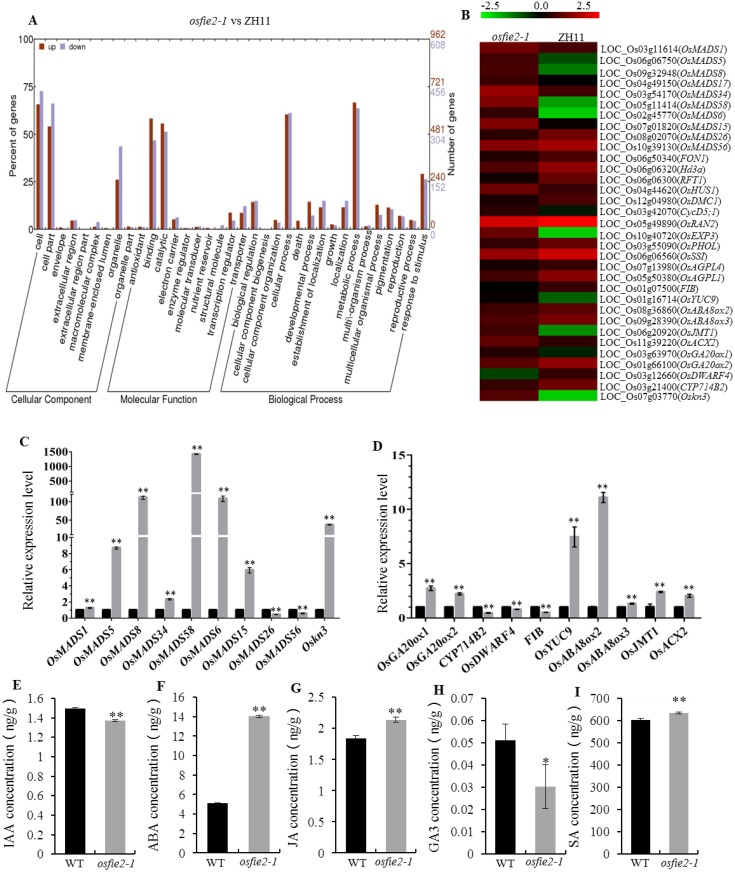
Fig 6. RNA-seq-based and qPCR analysis of differentially expressed genes.
A, GO enrichment analysis of differentially expressed genes (DEGs). B, Heatmap showing the expression levels of DEGs in osfie2-1 according to RNA-seq. C, Expression level of homeobox OsMADS-BOX genes and Oskn3 in wild-type and osfie2-1. D, Expression level of phytohormone-related genes. E-I, Phytohormones content in wild-type and osfie2-1. Data are given as mean ± SD of three biological replicates. Student’s t-test was used to generate the P values; * and ** indicate P<0.05 and P<0.01, respectively.

