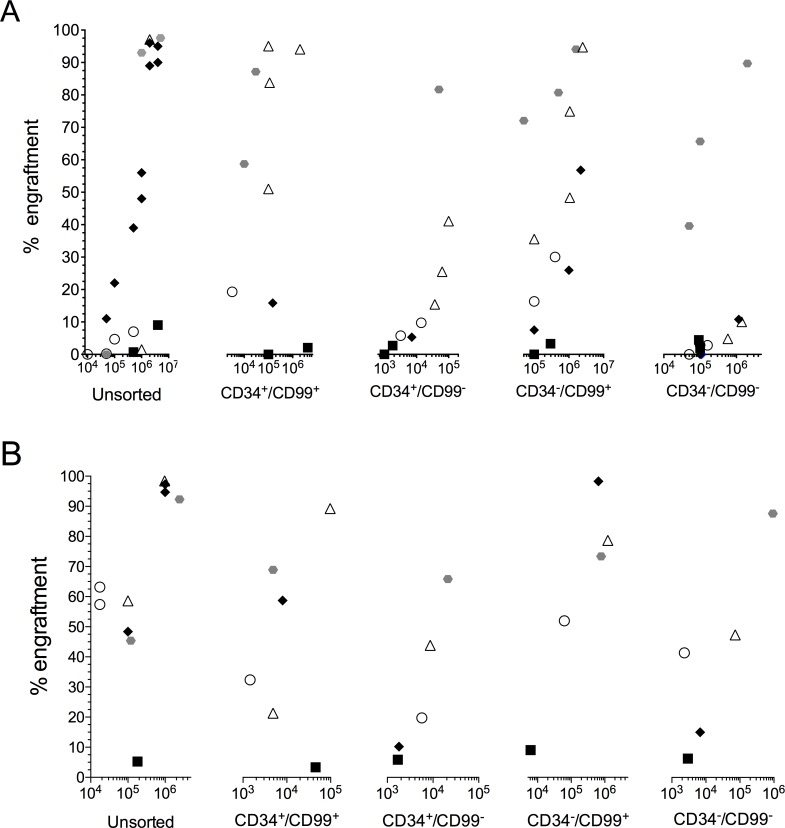
Fig 3. NSG engrafting capacity of CD34/CD99 subpopulations.
T-ALL cells from 5 cases (pts 2, 3, 4, 6, 9) were sorted based on expression of CD34/CD99 and the repopulating capacity of each sorted population was assessed in NSG mice (A). Each patient is represented by a specific symbol and each symbol depicts the engraftment detected in the BM of an individual mouse by flow cytometric analysis, measured by anti-human CD45 antibody. (B) Cells harvested from the BM of some engrafted primary recipients were inoculated into secondary NSG recipients. The X axes depict the number of cells inoculated from each sorted subpopulation (A) or from primary xenograft source (B).

