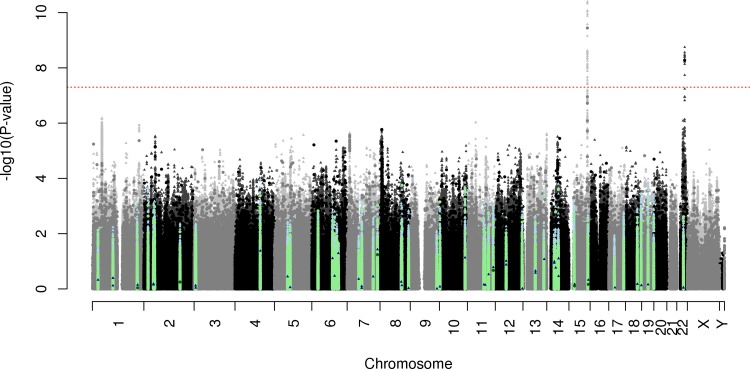
Fig 2. ARHI Manhattan plot in GERA non-Hispanic whites.
SNPs meeting genome-wide significance (p<5x10⁻⁸) are above the red line. The circles indicate genotyped SNPs, and the triangles indicate imputed SNPs. Dark colored points indicate previously-described sub-threshold suggestive hits, and light colored points are within 0.5Mb of the actual SNP (blue imputed, green genotyped).

