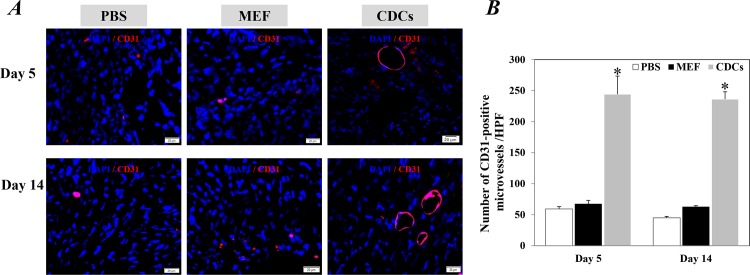
Fig 4. Microvessel density around the border zone of infarction 5 and day 14 after treatments.
(A) Representative images showed the microvessels stained positively with CD31 antibody. The nuclei were stained with DAPI. Scale bar: 20 μm. (B) Quantitative data of microvessel density are the mean± SEM from 5 or 6 independent individuals at each time point in each group. *p<0.05 versus control groups for each time point. CDCs: Cardiosphere-derived cells; MEF: mouse embryonic fibroblasts.

