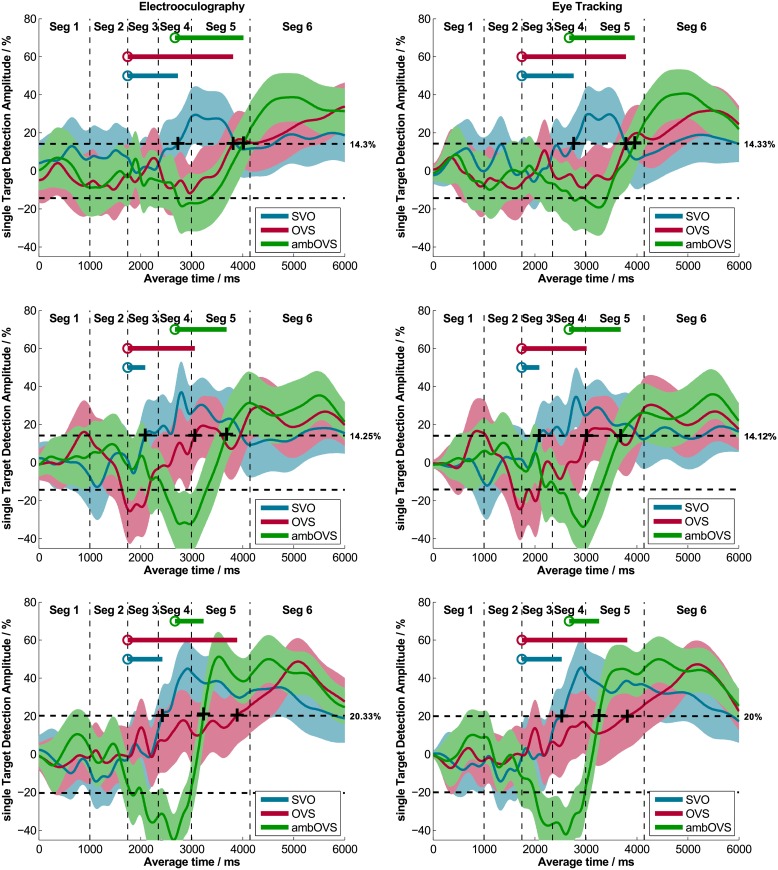
Fig 2. Single target detection amplitudes (sTDAs) recorded with EOG and ET.
Three exemplary participants recorded simultaneously with EOG (left panel) and ET (right panel) are shown. The colored areas represent the 95% confidence intervals. The plus signs denote the DM where the sTDA first exceeds a relative threshold (indicated right beside the dashed line) and the circles describe the PTD for each sentence structure. The line starting from the PTD indicates the DDD, which represents the sentence comprehension processing duration.

