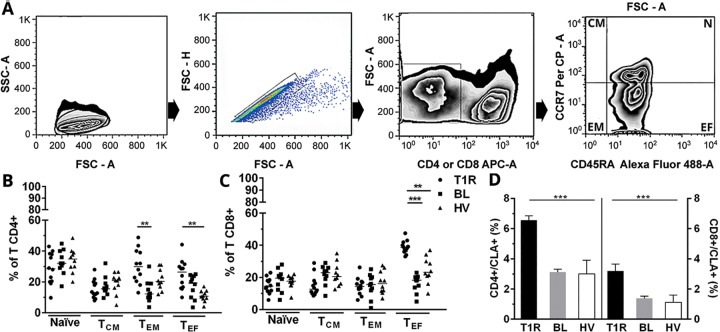
Fig 1. Increase of ex vivo CD4+ and CD8+ T subsets from BL patients at T1R.
(A) Methodology for analysis of lymphocytic subsets isolated from newly obtained peripheral blood (time zero, T0) in FACSAria flow cytometer. Exclusion of dead cells (kit Live/Dead) and determination of lymphocyte region (FSC-A versus SSC-A; first dot plot at left). Exclusion of cell clumps by FSC-H X FSC-A (second dot plot at left). Determination of CD3+/CD4+ or CD3+/CD8+ T cells regions, by using specific monoclonal antibodies and isotype control (third dot plot) and subset analysis by marking with anti-CD45RA Alexa Fluor 488 versus anti-CCR7 PerCP antibodies (first dot plot at right). Ex vivo frequencies of CD4+ (B) and CD8+ T subsets (C). Significantly increased ex vivo frequency of double positive CD4+/CLA+ and CD8+/CLA+ T cells in T1R patients (D). Results represent a median ± SEM of isolated experiments from T1R (n = 12), BL (n = 10) and HV (n = 10). Significance levels are shown by the graphs, being **p<0.01 and ***p<0.001. Mann–Whitney test; comparison between groups.

