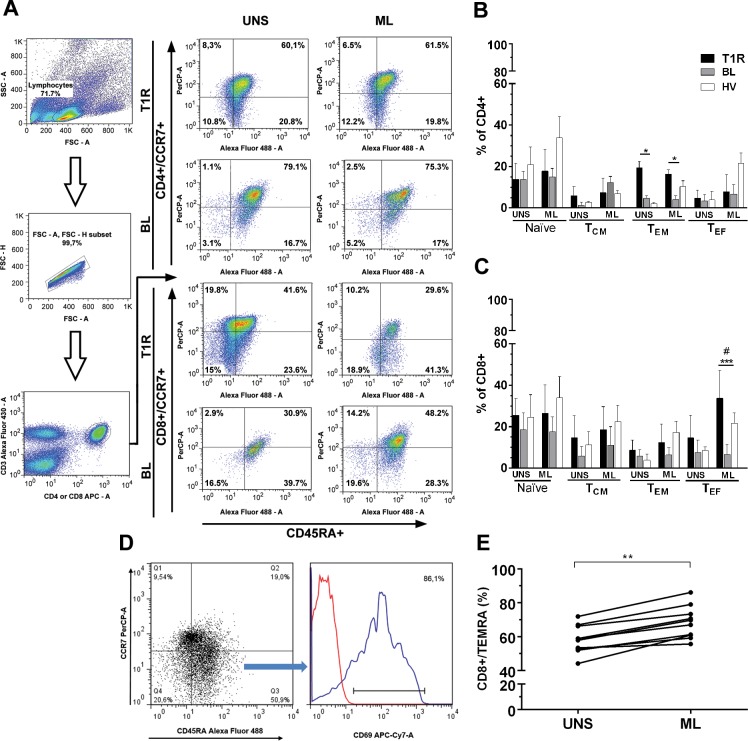
Fig 2. M. leprae increases the percentage of activated CD4+ (TEM) and CD8+ (TEF and TEMRA) phenotypes in T1R patients.
(A) Analysis methodology, as described by Fig 1 legend, in addition to subsets distribution upon unstimulated 6h-culture (UNS) and with 20μg/mL M. leprae (ML). The bars represent medians of CD4+ (B) and CD8+ (C) T activated cells. The lines above the bars represent SEM of isolated experiments from R1T (n = 12), BL (n = 10) and HV (n = 10). Kruskal-Wallis test with post-test Dunns were employed to determine differences between stimulated with ML or SEB (data not shown) and unstimulated cells (UNS). Mann–Whitney test was used for comparison between groups. Significance levels are shown by the graphs, being *p<0.05, **p<0.01 and ***p<0.001. # indicates CD69+hi expressing TEF cells (%), as shown by figure D. (E) Among T1R patients, CD8+/TEMRA cells were increased by M. leprae (ML) in comparison with UNS.

