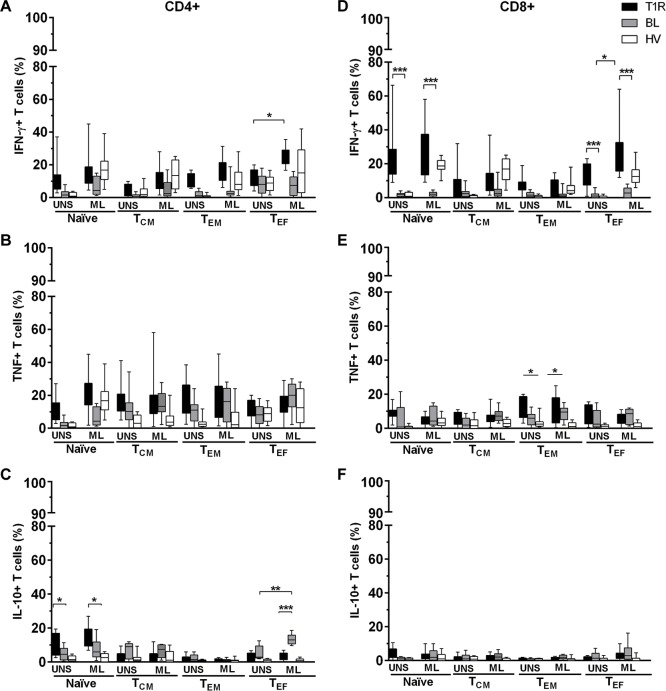
Fig 3. IFN-γ- and TNF-producing CD4+ and CD8+ T cells are predominant in T1R group, while IL-10-producing CD4+ T cells are increased in non-reactional BL patients.
IFN-γ-, TNF- and IL-10-producing CD4+ (A-C) and CD8+ (D-F) T subsets in 6h-PBMC culture were: unstimulated (UNS), 20μg/mL M. leprae (ML) and 1μg/mL SEB (data not shown). Results are reported as % of median and interquartiles (25th and 75th percentile) in T1R (n = 12), BL (n = 10) and HV (n = 10) groups. Kruskal-Wallis with post-test Dunns were employed to determine differences between stimulated (ML or SEB) and unstimulated cells (UNS). Mann–Whitney test was used to group comparisons; *p<0.05, **p<0.01 and ***p<0,001.

