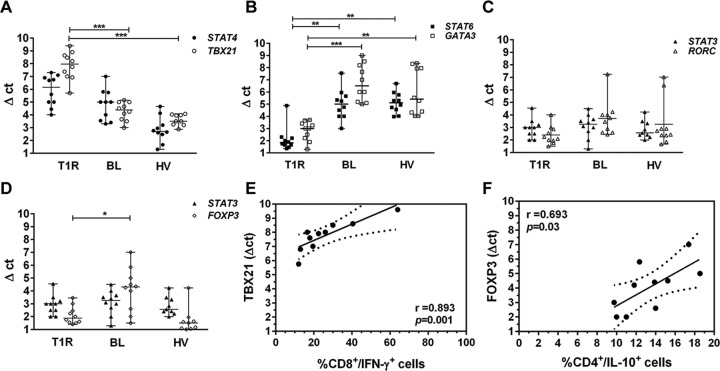
Fig 4. Increased TBX21 in T1R group is associated with IFN-γ+-producing CD8+ T cells, while FOXP3 is associated with IL-10+-producing CD4+ T cells in BL patients.
Scattergram showing the expression of gene pairs STAT4/TBX21 (A), STAT6/GATA3 (B) STAT3/RORC (C) and STAT3/FOXP3 (D). Quantitative RT-PCR analysis in peripheral blood of T1R patients (open symbols) and BL (closed symbols) and HV (open triangles). The y-axis of each graph represents the relative expression of the respective genes calculated using the Δct method and normalized against GAPDH mRNA. Results are reported by Δct mean ± range of 10 independent samples of each group. *p<0.05, **p<0.01 and **p<0.001 (Mann–Whitney test). Spearman rank correlations of TBX21 expression with IFN-γ-producing CD8+ T cells from T1R group (E), and FOXP3 expression with IL-10-producing CD4+ T cells from BL patients (F) are shown.

