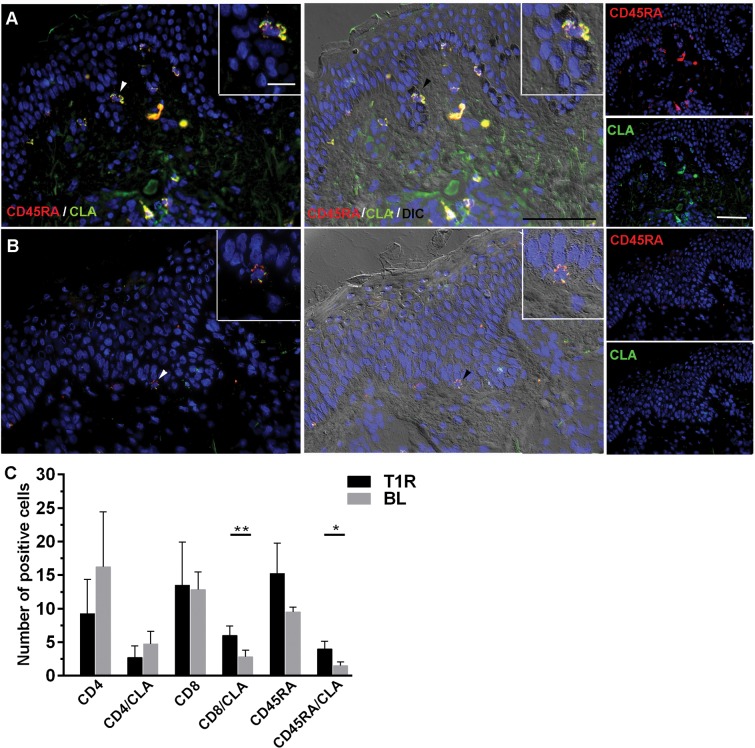
Fig 5. CD8+/CLA+ and CD45RA+/CLA+ T lymphocytes are predominantly expressed in T1R lesions.
Immunofluorescence assays were performed to determine the number of T cell markers (CD4, CD8 and CD45RA) expressing or not CLA. Representative images presented CD45RA+ (red, Alexa Fluor 633; upper right panels) and CLA+ (green, Alexa Fluor 488; lower right panels), colocalization (yellow, white arrow head and insert; left panels). The nuclei (blue) were stained using DAPI. Scale bar = 50 mm. Data are representative of 3 specimens of each group, being one T1R (A) and one BL patient (B). Images were visualized and obtained by a Zeiss Colibri fluorescent microscope. The graph shows single and double-positive CD4+/CLA+, CD8+/CLA+ and CD45RA+/CLA+ cells in T1R and BL skin infiltrates (C). *p<0.05 and **p<0.01 (Mann-Whitney test; group comparisons).

