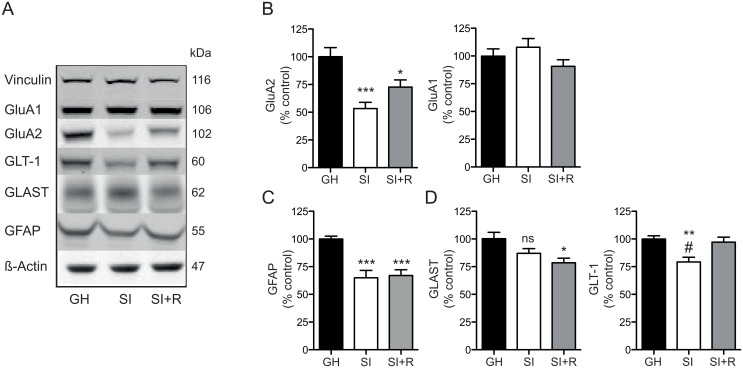
Fig 3.
A-C. Representative western blots with their corresponding molecular weights (kDa) (A) and densitometry analysis for the different tested proteins: AMPA-R subunits: GluA1-2 (B), the astrocytic marker GFAP (C) and glial glutamate transporters: GLAST and GLT-1 (D) presented as percentage (%) of GH (control group) after normalization to β-actin or vinculin (loading control). Bar-graph data represent means ± s.e.m. (N = 6–8 animals per group). GH: group-housed, SI: social-isolated, SI +R: social-isolated with access to a running wheel. ***, * vs. GH; # vs. SI+R; one-way ANOVA followed by Bonferroni’s multiple comparisons test. GH:group-housed, SI: social-isolated, SI +R: social-isolated with access to a running wheel.

