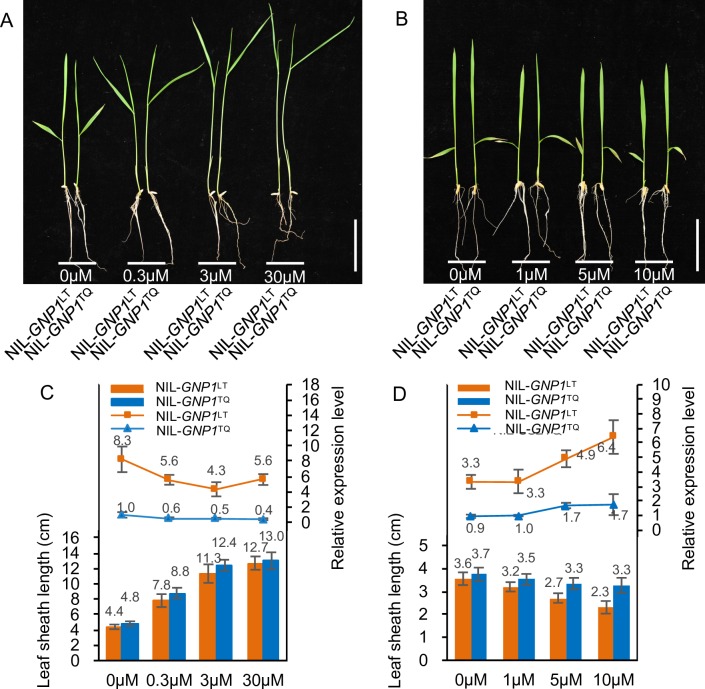
Fig 4. The response of GNP1 to various treatments.
(A) Dose-dependent response of leaf sheath length in NIL-GNP1LT and NIL-GNP1TQ to GA3 treatment. Scale bar, 5 cm. (B) Dose-dependent response of leaf sheath length in NIL-GNP1LT and NIL-GNP1TQ to uniconazole-P treatment. Scale bar, 5 cm. (C) Comparison of leaf sheath length (n = 48) together with the relative expression levels of GNP1 in treated seedling leaf sheaths (n = 6, each with 8 plants) among different GA3 treatments for NIL-GNP1LT and NIL-GNP1TQ seedlings. Values are means ± s.d. (D) Comparison of leaf sheath length (n = 48) together with the relative expression levels of GNP1 in treated seedling leaf sheaths (n = 6, each with 8 plants) among different uniconazole-P treatments for NIL-GNP1LT and NIL-GNP1TQ seedlings. Values are means ± s.d.

