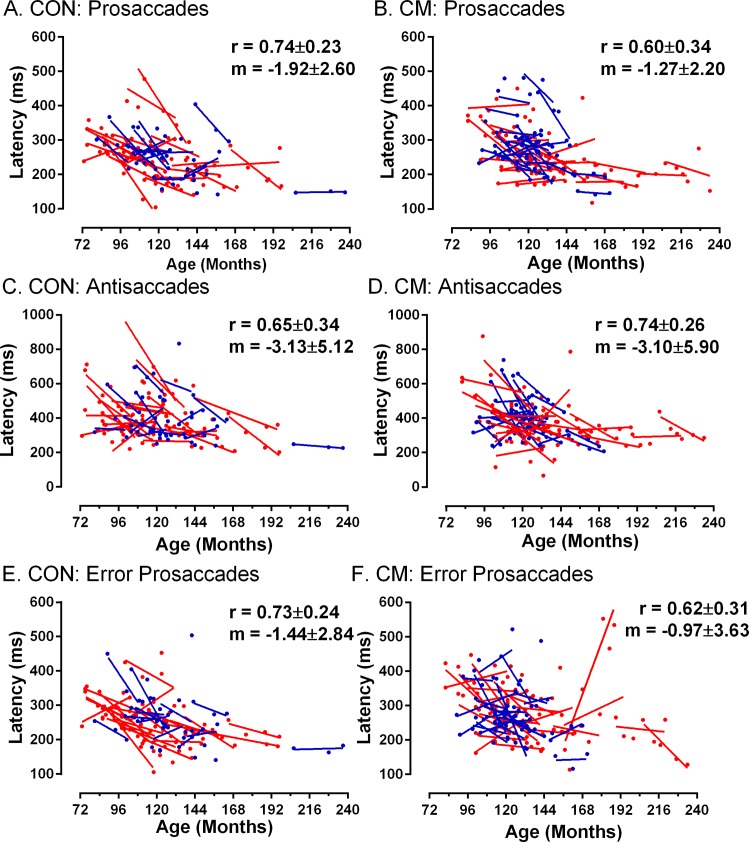
Fig 1. Effect of age on the latency of three types of saccade.
Prosaccades: A,B; correct antisaccades: C,D; error prosaccades from antisaccade tasks: E, F. Control (CON A,C,E) and Cerebral Malaria (CM B,D,F) groups. Data from each participant in each testing session is plotted, and summarised using a least-squares linear regression line. Where data is available for four test sessions it is plotted in red, data from participants tested over three sessions is plotted in blue. On each plot the mean (±SD) Pearson correlation coefficient (r) and gradient of the regression lines (m) is shown, averaged over all participants in the group. Note that the y-axis scale differs for C and D.

