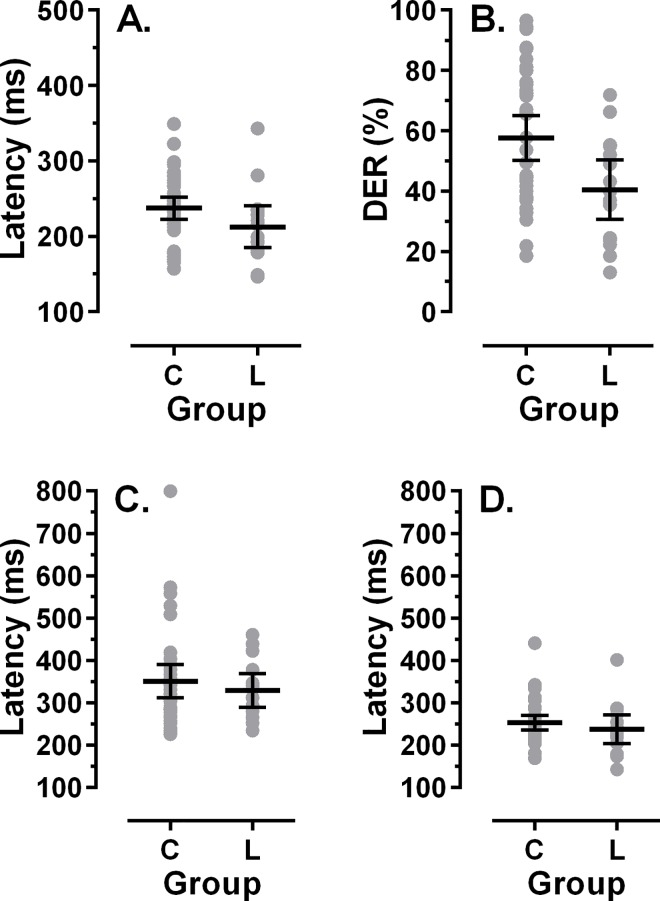
Fig 4. Comparison of cross-sectional and longitudinal data.
Cross-sectional data from the participants from the BRINK cohort (C) is compared to data from participants aged >144 months in the longitudinal study (L). In each plot individual participants’ data is shown, with the mean±95% CI. A. Prosaccade latency. B. Antisaccade directional error rate (DER). C. Correct antisaccade latency. D. Error prosaccade latency from the antisaccade task. Note different axis scales between A and C, D.

