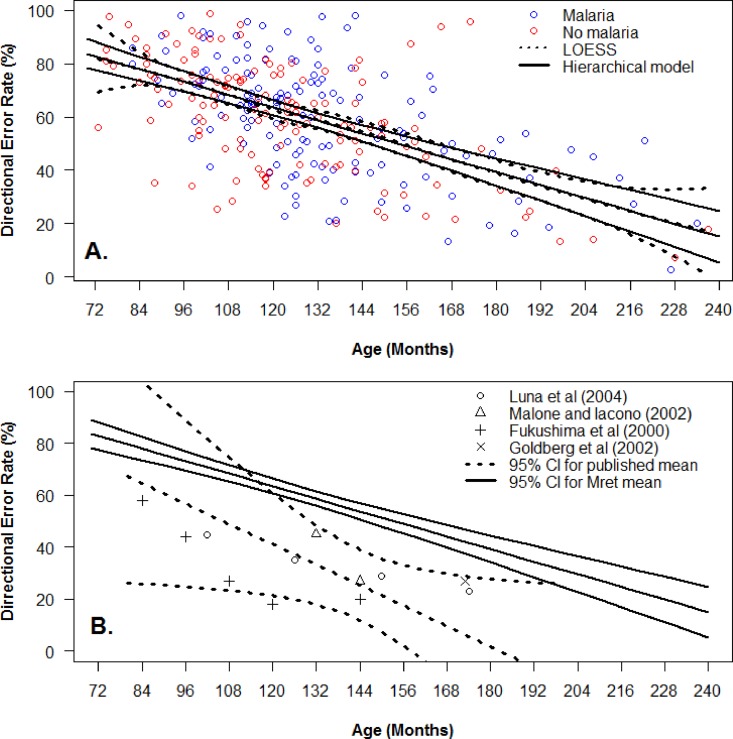
Fig 5. Effect of age on DER in combined Malawi group, and comparrision with data from the literature.
A. Combined analysis of data from cerebral malaria (blue) and control (red) groups in the longitudinal study. Both hierarchical linear model (solid lines) and LOESS fits (dotted lines), ±95% CI are shown. B. Comparison of hierarchical linear model (solid lines) from longitudinal Malawi dataset, with a weighted mixed-effect linear model constructed from data extracted from four published studies in which a synchronous antisaccade task was used (dashed lines). Central estimates ±95% CI shown.

