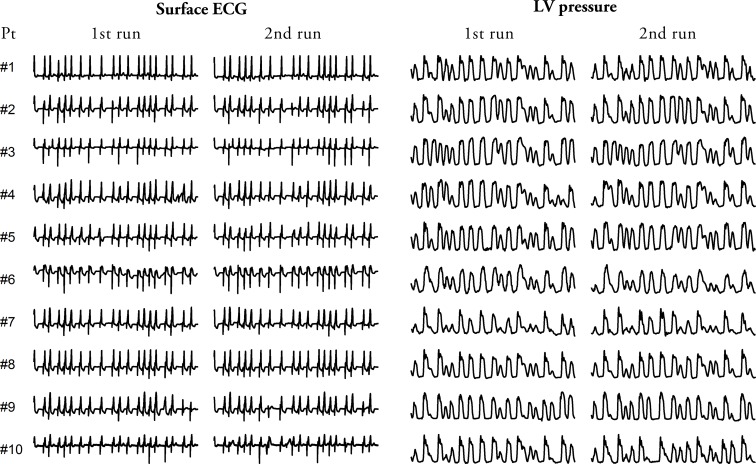
Fig 3. Sample of ECG with corresponding LV pressure signal during simulated AF.
The figure shows a 10s sample of ECG and a corresponding LV pressure tracing recorded in all the study patients during two separate runs of the simulated AF. It can be appreciated that (i) the His pacing generated narrow QRS complexes thus indicating intrinsic activation of the ventricles, (ii) the RR intervals followed the same pattern in all the patients at both runs, (iii) the simulated AF generated similar LV pressure tracings among all the patients, (iv) the LV pressure tracings were almost identical within each patient at the two separate runs. Pt = patient.

