. 2016 Sep 24;5:e18857. doi: 10.7554/eLife.18857

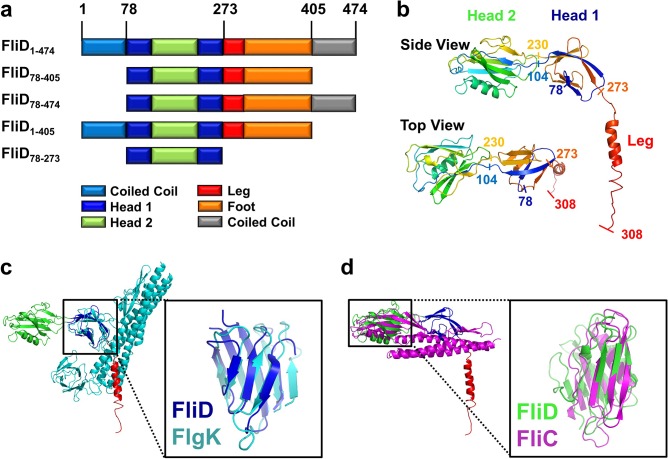
Figure 1. Crystal structure of Pseudomonas FliD reveals structural similarity to other flagellar proteins.

(a) Schematic representation of the FliD proteins used in these studies. Protein domain/region boundaries are labeled and are drawn approximately to scale. (b) Crystal structure of the Pseudomonas FliD78–405 monomer subunit with spectrum coloring from the N-terminus (blue) to the C-terminus (red). Head domain 1, head domain 2 and the leg region are indicated. (c) Superposition of the FliD78–405 crystal structure (domain coloring as in panel (a)) and Burkholderia FlgK/HAP1/hook filament capping protein (cyan). (d) Superposition of the FliD78–405 crystal structure (domain coloring as in panel (a)) and Pseudomonas flagellin/FliC (magenta).

DOI: http://dx.doi.org/10.7554/eLife.18857.003

Figure 1—source data 1. Crystallographic data collection, phasing and refinement statistics.
DOI: 10.7554/eLife.18857.004

Figure 1.

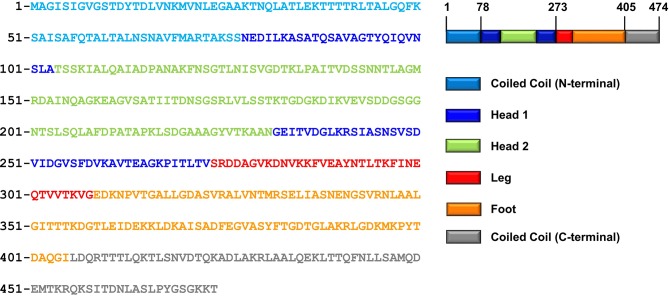
Figure 1—figure supplement 1. Protein sequence of FliD1–474.

Figure 1—figure supplement 1.

The protein sequence of FliD from P. aeruginosa PAO1 is shown. The tertiary domain structure based on the presented X-ray crystal structure and the predicted secondary structure is indicated.
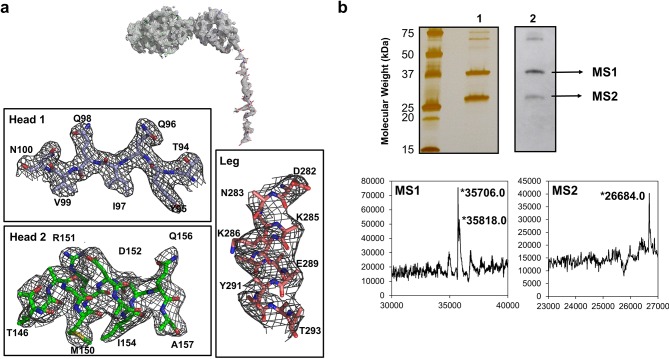
Figure 1—figure supplement 2. Electron density and protein degradation of FliD crystals.

Figure 1—figure supplement 2.

(a) The overall electron density observed in the crystal structure of FliD is shown. Close-up views of representative residues in the head 1, head 2 and leg regions reveal low-quality and missing side-chain density in the leg region in comparison to the well-structured head domains. (b) SDS-PAGE (lane 1) and anti-His6-horseradish peroxidase (lane 2) Western blot analysis reveal C-terminal degradation of FliD78–405 in crystals. LC-MS analysis indicates the presence of the native FliD78–405 protein and degradation products in crystals of FliD78–405.