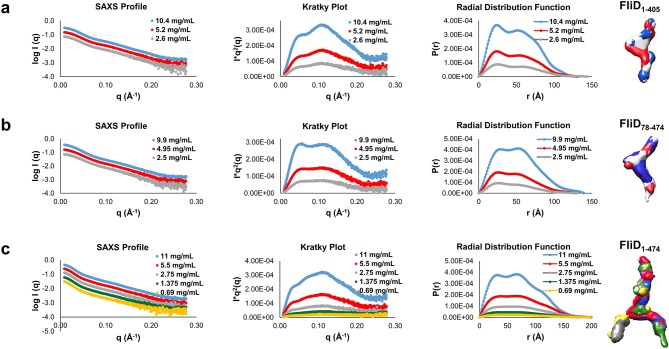
Figure 6. Small angle X-ray scattering (SAXS) data of FliD1–405, FliD78–474 and FliD1–474.
Log-scale intensity SAXS profiles, Kratky Plot (I × q2 versus q), radial distribution function calculated by GNOM and SAXS envelopes calculated by DAMMIF are shown for: (a) FliD1–405 at 10.4 mg/mL (blue), 5.2 mg/mL (red) and 2.6 mg/mL (grey); (b) FliD78–474 at 9.9 mg/mL (blue), 4.95 mg/mL (red) and 2.5 mg/mL (grey); and (c) FliD1–474 at 11 mg/mL (blue), 5.5 mg/mL (red), 2.7 mg/mL (grey), 1.38 mg/mL (green) and 0.69 mg/mL (yellow).
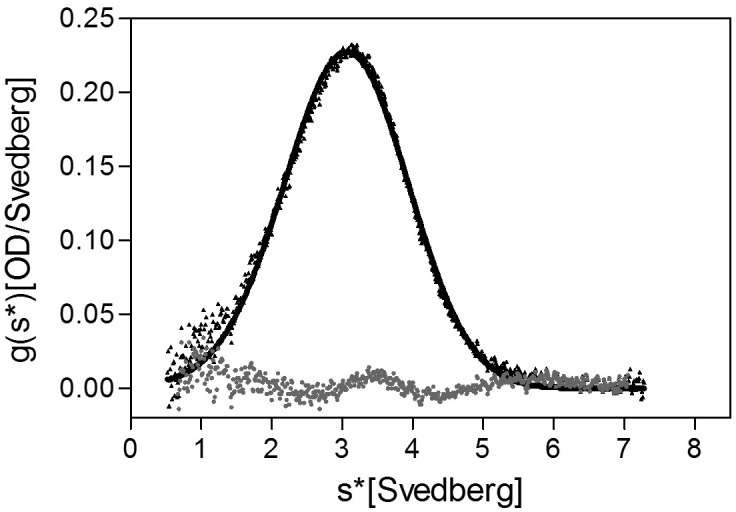
Figure 6—figure supplement 1. Analytical ultracentrifugation (AUC) analysis of FliD1–474 at pH 11.0.


