
Figure 1.
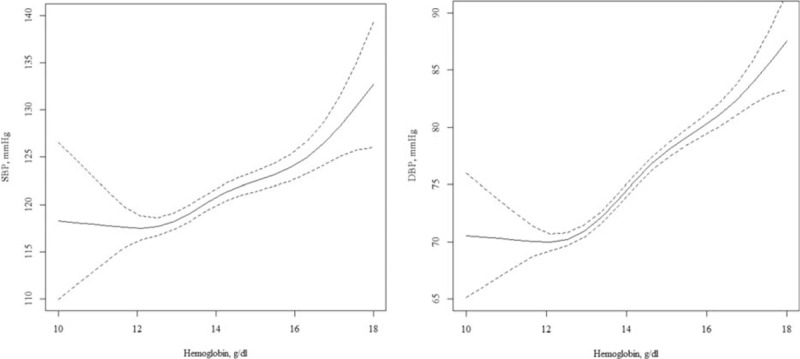
Cross-sectional association between hemoglobin and blood pressure in unadjusted model. Solid (dotted) lines present the odds ratio (95% confidence interval) for blood pressure in relation to hemoglobin, as a function of penalized regression splines.