Figure 3.

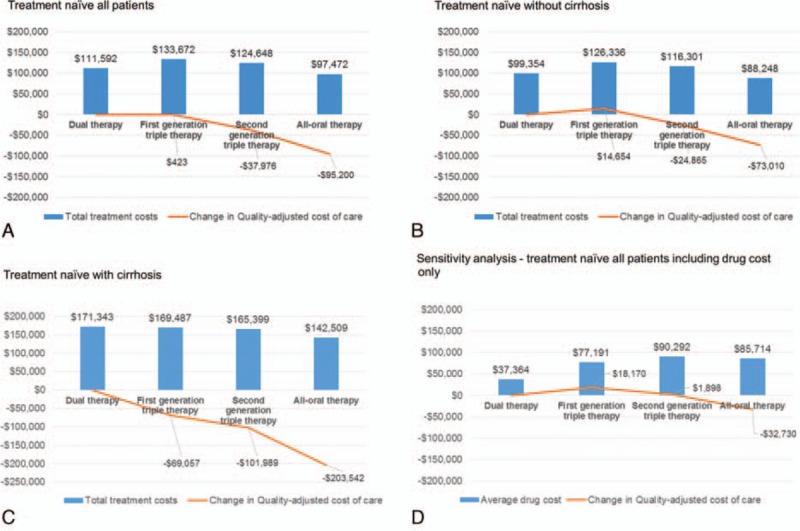
Trends in cost of treatment and quality-adjusted cost of care for HCV. (A) Treatment naïve all patients, (B) treatment naïve without cirrhosis, (C) treatment naïve with cirrhosis, and (D) sensitivity analysis.

Trends in cost of treatment and quality-adjusted cost of care for HCV. (A) Treatment naïve all patients, (B) treatment naïve without cirrhosis, (C) treatment naïve with cirrhosis, and (D) sensitivity analysis.