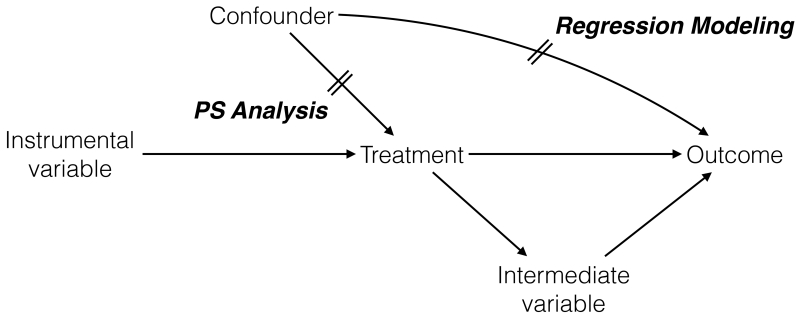
Figure 1. Causal Diagram Representing Confounder, Instrumental Variable, and Intermediate Variable.
In this causal diagram, a variable is called a confounder if 1) it is associated with the treatment (confounder → treatment); 2) it is associated with the outcome, independently of the treatment (confounder → outcome without its effect through treatment); and 3) it is not affected by the treatment (not treatment→confounder). A variable is called an instrumental variable if it is only associated with the treatment (instrumental variable → treatment) and not with confounder or outcome. A variable that mediates the effect of the treatment on the outcome (treatment → intermediate variable → outcome) is called an intermediate variable. To reduce confounding, propensity score analysis focuses on the confounder-treatment relationship, while regression modeling focuses on the confounder-outcome relationship.

