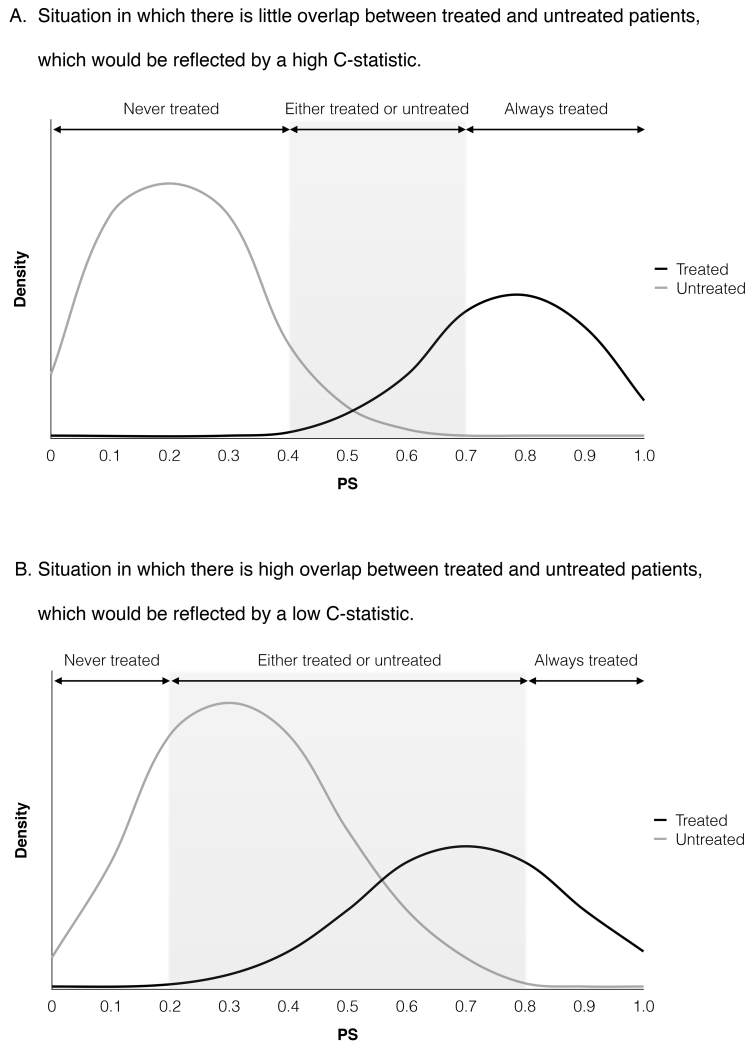
Figure 2. Hypothetical Distribution of Propensity Scores Between Treated and Untreated Patients.
Abbreviation: PS, propensity score.
Figure 2A depicts a situation with high C statistic, in which the propensity score clearly distinguishes treated patients from untreated patients and there is a small overlap in propensity score. This may reflect a consistent clinical practice regarding treatment use or inclusion of strong predictors of the treatment, such as instrumental variables. Figure 2B depicts a situation with low C statistic, in which the propensity score modestly distinguishes treated patients from untreated patients and there is a large overlap in propensity score. This may indicate that a majority of patients have a chance of being treated or untreated, or that important confounders may have been omitted.

