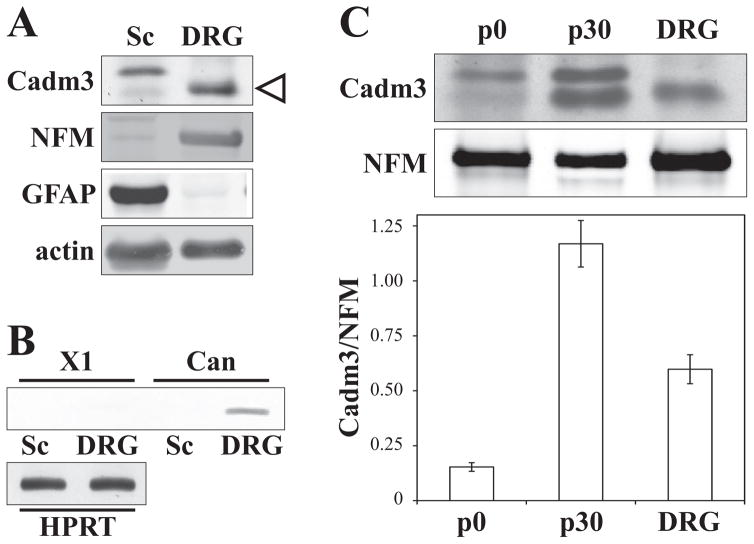
Figure 6. Comparative assessment of Cadm3 expression in vitro and in vivo.
Lysates of Schwann cells (Sc), DRG neurons (DRG), post-natal day 0 (p0, birth) and day 30 (p30) sciatic nerves were qualitatively (panel A) and quantitatively (panel C) analyzed for the expression of Cadm3. Two bands were detected at 43 kDa (lower band indicated by open triangle) and 47 kDa. Neurofilament (NFM) and GFAP were used as DRG neuron and Schwann cell specific markers, respectively. PCR analysis (panel B), done on DRG and Schwann cell cDNA, detected a specific 118bp product for the canonical (Can), 43 kDa Cadm3, in DRG neurons only. No band (129bp) for a computationally predicted 47 kDa splice variant (X1) was detected in Schwann cells. HPRT1 is used as control. The 43 kDa was used for the quantitation shown in panel C, normalized to NFM. Values represent the mean ± SEM from n = 3 independent experiments.

