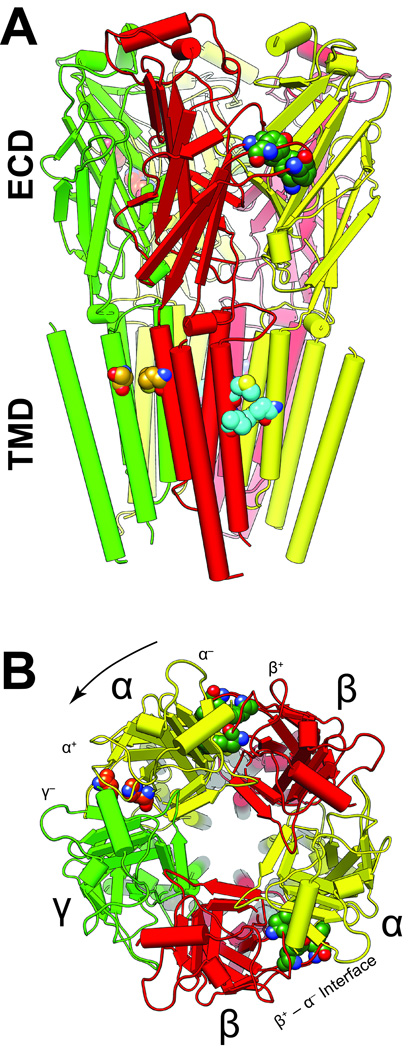
Figure 1. The locations of modulatory sites in a structural model of α1β3γ2L GABAARs.
The structure shown was obtained by homology modeling based on the GluCl chloride channel (3RHW.pdb) (7,26). The five subunits are arranged around a central ion–conducting pore and colored as follows: α1, yellow; β3, red, and γ2 green. The α-helices are represented as cylinders, β-sheets as flat planks and loops as strings. A. A side view of the α1β3γ2L GABAAR homology model shows the extracellular domain (ECD) and the transmembrane domain (TMD). The intracellular domain is not modeled because no structural information is available. B. The extracellular domain viewed from the synapse, showing residues involved in agonist and BDZ binding. By convention, subunit order is counted in an anticlockwise direction (arrow). Important amino acids associated with various sites are distinguished by the color of their carbon atoms: agonist site, dark green (α1 Phe-65; β3 Tyr-157 & −205, Phe-200); benzodiazepine site (BDZ), orange (α1 His-102 & −210); azietomidate site, cyan (β3 Met-286 & Val-290, α1 Met-236); main R–mTFD-MPAB site, goldenrod (γ2 Ser-301, β3 Met-227). Red and blue atoms are oxygen and nitrogen respectively.

