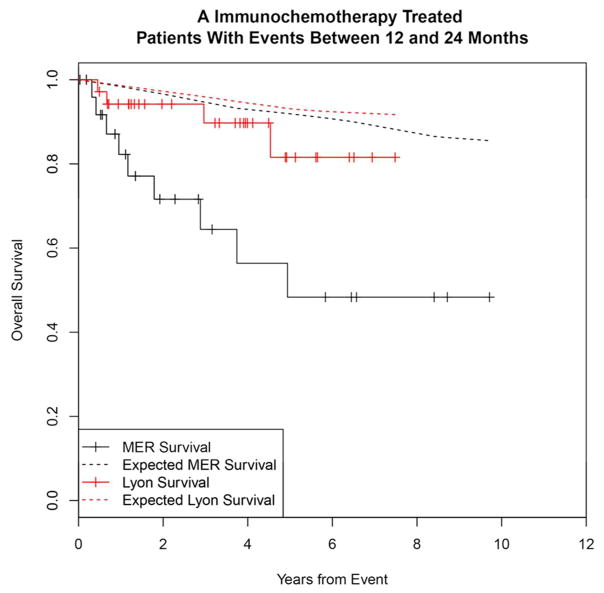
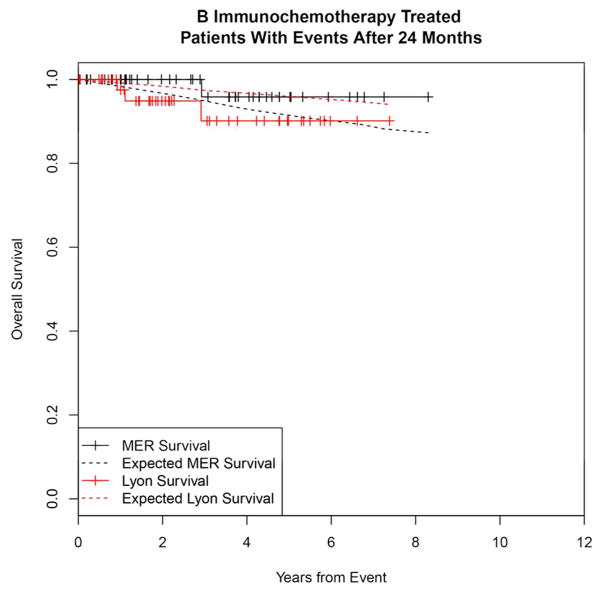
Figure 3.
Kaplan-Meier curve of subsequent overall survival in immunochemotherapy treated FL patients (black=MER, red=Lyon) with expected survival in the age and sex matched general population (black dashed=MER/US, red dashed=Lyon/France); A: Survival after event in patients with events between 12 and 24 months, B: Survival after event in patients with events after 24 months.


