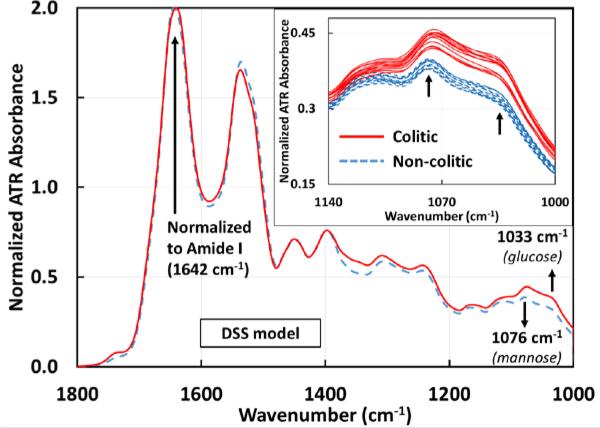
Figure 2.
Averaged ATR-FTIR spectra of sera drawn from mice before (n=12) and after (n=12) developing colitis induced by 3% DSS. The differentiating markers 1033 and 1076 cm−1 are identified as glucose and mannose with p-values of 4.43E-8 and 7.59E-8 respectively. The inset shows the individual serum samples from 1140 – 1000 cm−1 for clarity. Individual colitic and non-colitic spectra show a clear separation between the groups. With further data points it should be possible to find an absorbance range for the two groups. All spectra are normalized to the Amide I peak (1642 cm−1). The averages for the glucose peak are 0.3175±0.0024 (non-colitic) and 0.3788±0.0041 (colitic) and the averages for the mannose peak are 0.3847±0.0022 (non-colitic) and 0.438±0.0035 (colitic).

