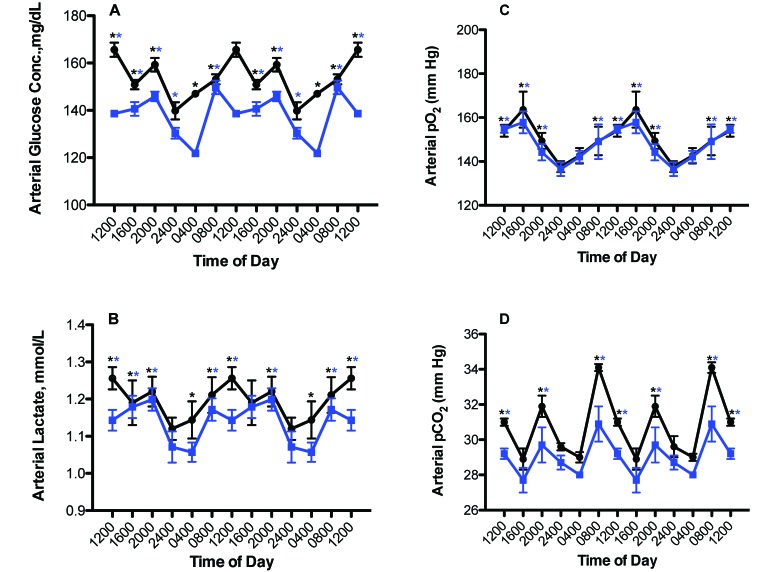
Figure 4.
Circadian changes in arterial blood (A) glucose, (B) lactate, (C) pO2, and (D) pCO2 levels (mean ± 1 SD; n = 12 per group) of male rats maintained on either control (solid black circles), or experimental (solid blue squares) lighting conditions. Rats were exposed to dark-phase lighting conditions from 1800 to 0600 (dark bars). Data are plotted twice to better visualize rhythmicity. Rhythmicity analysis (Table 2) revealed robust and highly significant (P < 0.0001) rhythmic patterns for both control (CWF) and experimental (LED) groups but a significantly disrupted (P < 0.05) phase pattern for the LED group. *, P < 0.001 experimental (LED) with control (CWF) conditions (Student t test); concentrations with asterisks (black, CWF peaks; blue, LED peaks) differ (P < 0.05) from concentrations without asterisks.

