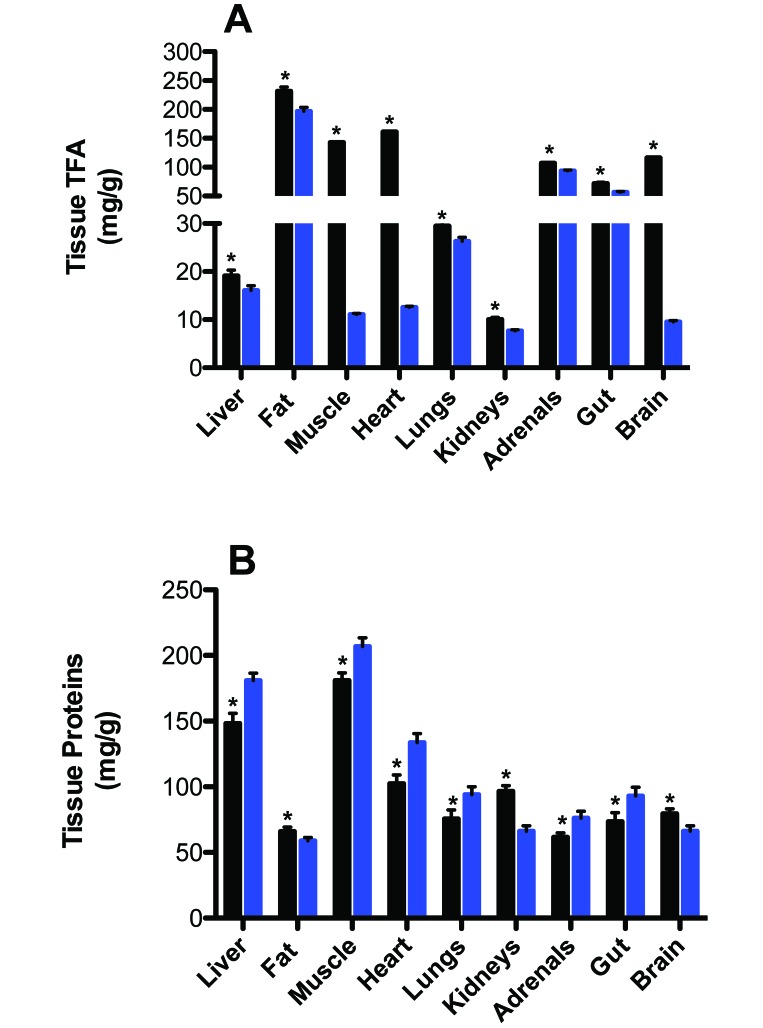
Figure 6.
Tissue (A) total fatty acid (TFA) and (B) protein concentrations in CWF light (solid black bar) compared with LED (solid blue bar) groups in liver, adipose (epigastric fat depot), hindlimb skeletal muscle, heart, lung, kidneys, adrenal, small intestine [gut], and brain tissues. Each bar represents the mean ± 1 SD (n = 12 per group). Concentrations with asterisks differ (P < 0.05) from concentrations without asterisks.

