
Fig. 3.
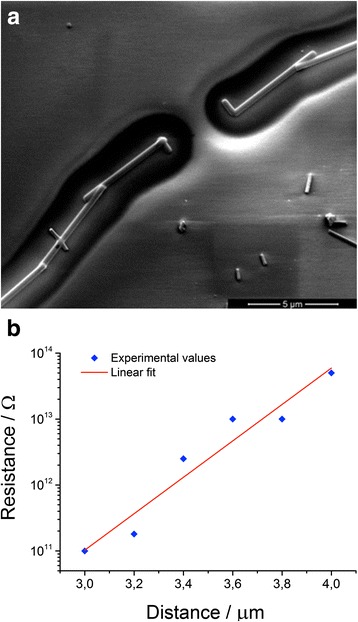
a SEM images taken at 1 kV of acceleration voltage of a couple of Pt electrodes at 4.0 μm of distance, made with a layout that minimizes the overlapping area. The relief appearance is explained in the capture of Fig. 2. At this distance, the halos around the Pt electrodes appear to be by around 1 μm separated. In b, a semi-log graph shows the measured resistance between the electrodes as a function of the distance. The linear fit points out an exponential law