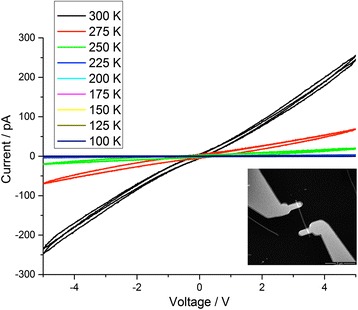
Fig. 5.

I–V curves of SiNWs contacted with the EBL method at different temperature (from 100 to 300 K). Each curve represents two voltamperogrames cycles. A little hysteresis is detectable as well as a slight instability of the curves. In the inset, a SEM image of the measured SiNW
