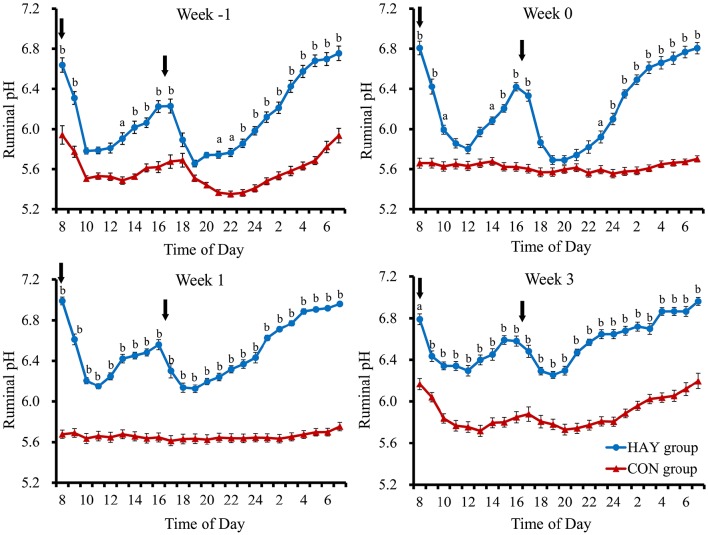
Figure 2.
Diurnal changes in the 1-h mean ruminal pH in Holstein bull calves fed calf starter with (HAY group, n = 8) and without (CON group, n = 8) forage. Week −1, Week 0, Week 1, and Week 3 represent calves at − 1, 0, 1, and 3 weeks after weaning, respectively. Values represent the means ± SE. Arrows indicate feeding times (08:00 and 16:30). a and b denote significant differences (P < 0.05 and P < 0.01, respectively) between the HAY and CON groups at the same time point.

