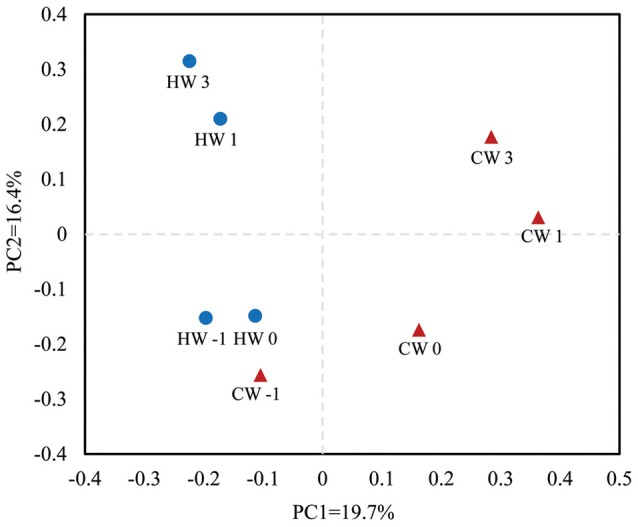
Figure 3.

Principal coordinate analysis plots generated from the 454 pyrosequencing data. PC1 and PC2 represent principal components 1 and 2, respectively. HW-1, HW0, HW1, and HW3 represent calves at −1, 0, 1, and 3 weeks, respectively, after weaning in the HAY group (n = 8), and CW-1, CW0, CW1, and CW3 represent calves at −1, 0, 1, and 3 weeks, respectively, after weaning in the CON group (n = 8). Blue circles represent the HAY group and red triangles the CON group.
