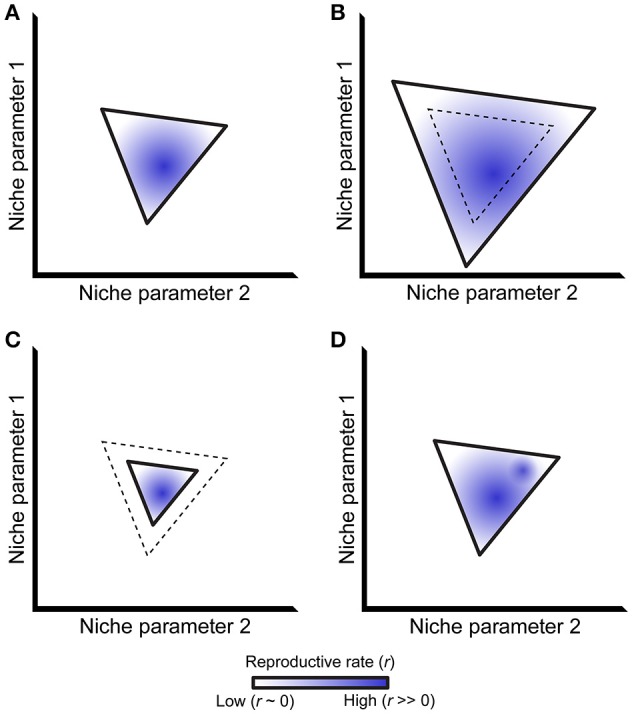
Figure 1.

The ecological niche and its relationship to reproductive rate. (A) A simplified niche projected along two axes, bounded by a solid line representing the isocline where a species' net reproductive rate (r) equals 0. Stable population growth only occurs within this isocline, although net reproductive rates differ within this region as represented by different shades of blue. (B-D): Niche boundaries may change relative to past conditions (dashed line) via expansion (B) or contraction (C). The distribution of net reproductive rates may also change within a set of unchanging niche boundaries (D), exemplified by the addition a second region of this niche having a high net reproductive rate. Although not shown in the figure, trade-offs may exist where niche boundaries both expand and contract in different parts of a species' niche alongside multiple changes in net reproductive rate.
