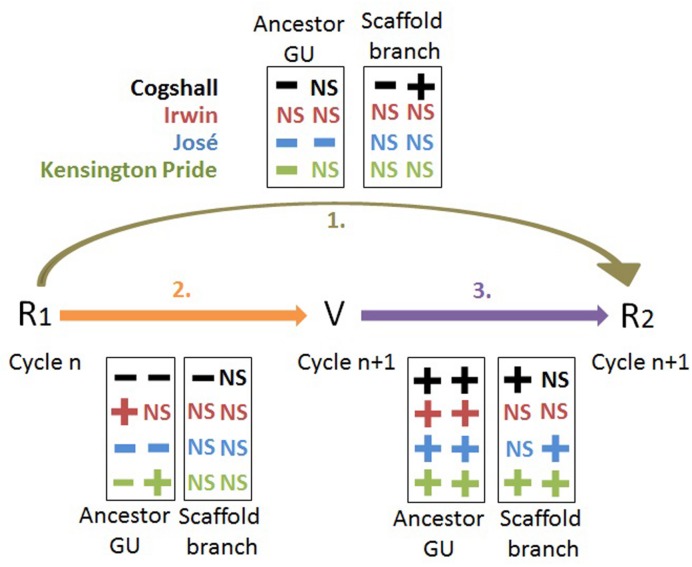
FIGURE 7.
Synthesis of the R1→V→R2 relationships. Relationships between reproduction (R1, R2) and vegetative growth (V), expressed as the leaf area of descendant GUs, for four mango cultivars at the scales of the ancestor GU and of the scaffold branch. The ‘+’ and ‘-’ symbols represent significant positive and negative relationships, respectively (P < 0.05), and NS indicates non-significant relationships. The first and second columns in each box represent the results from cycle 0 to cycle 1, and from cycle 1 to cycle 2, respectively, for R1→R2 and R1→V, and within cycle 1 and cycle 2, respectively, for the V→R2 relationships.

