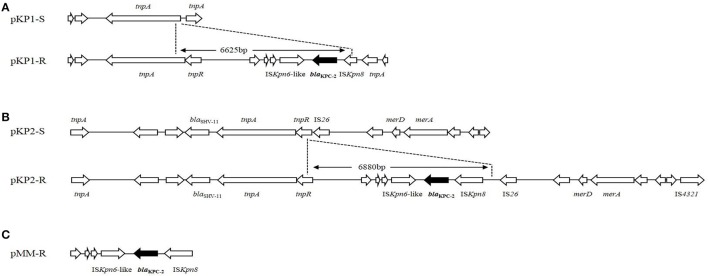
Figure 2.
Plasmid structures surrounding blaKPC−2 gene in K. pneumoniae and M. morganii. (A) Comparison between plasmids pKP1-S and pKP1-R. (B) Comparison between plasmids pKP2-S and pKP2-R. (C) blaKPC−2 and its surrounding genetic elements of plasmid pMM-R. The differences between the plasmids are shown, and the genes are depicted as arrows according to the direction of transcription. The dots indicated the inserted DNA sequences in pKP1-R and pKP2-R. The blaKPC−2 genes are shown in black.

