
Figure 3.
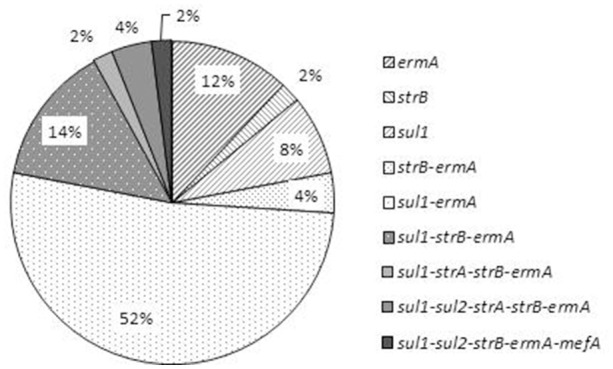
Distribution of the profiles of resistance-associated genes in the 50 V. cholerae non-O1/non-O139 isolates.
Official websites use .gov
A
.gov website belongs to an official
government organization in the United States.
Secure .gov websites use HTTPS
A lock (
) or https:// means you've safely
connected to the .gov website. Share sensitive
information only on official, secure websites.
Distribution of the profiles of resistance-associated genes in the 50 V. cholerae non-O1/non-O139 isolates.