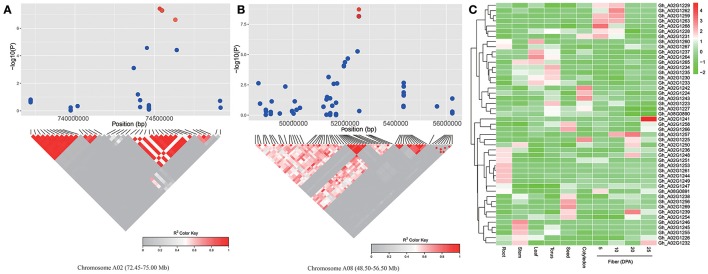
Figure 4.
Prediction of the candidate genes for lint percentage. (A) The peak region (72.45–75.00 Mb) on chromosome A02. (B) The peak region (48.50–56.50 Mb) on chromosome A08. (A,B) The pair-wise LD between the SNP markers is indicated as D' values, where dark red indicates a value of 1 and gray indicates 0. The dotted squares in (A,B) indicate the LD blocks that contain significant SNPs (red dot). (C) Heat map of the putative candidate gene expression patterns in 10 upland cotton (TM-1) tissues. Red indicates high expression, and green indicates low expression.

