
FIGURE 1.
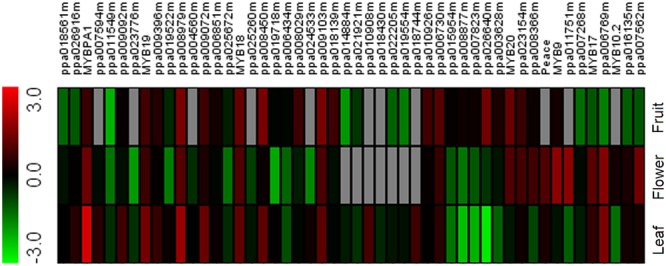
Heatmap of R2R3-MYBs in peach transcriptomes of different red-colored tissues. Green and red boxes indicate low- and high-expression levels, respectively. Red-colored leaf, flower, and fruit samples were collected from cv. Hongyetao, Hongbaihua, and Dahongpao, respectively.