
FIGURE 7.
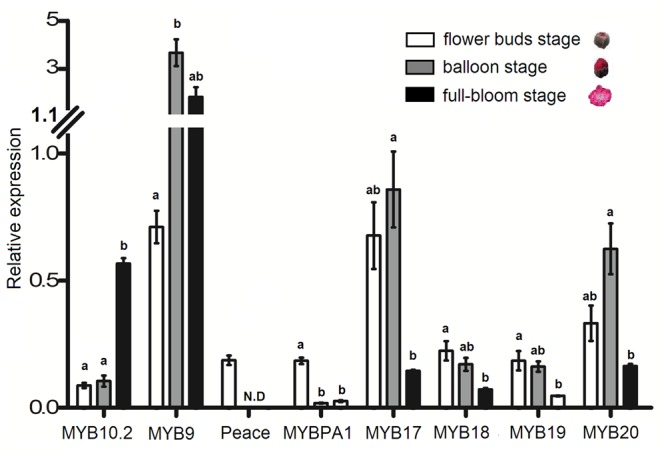
Expression profiles of the eight R2R3-MYBs in flowers of cv. Mantianhong at different developmental stages. Different lowercase letters indicate the significant differences among treatments by Tukey’s test at P < 0.01. Error bars show SE of the means of three biological replicates.