
FIG. 8.
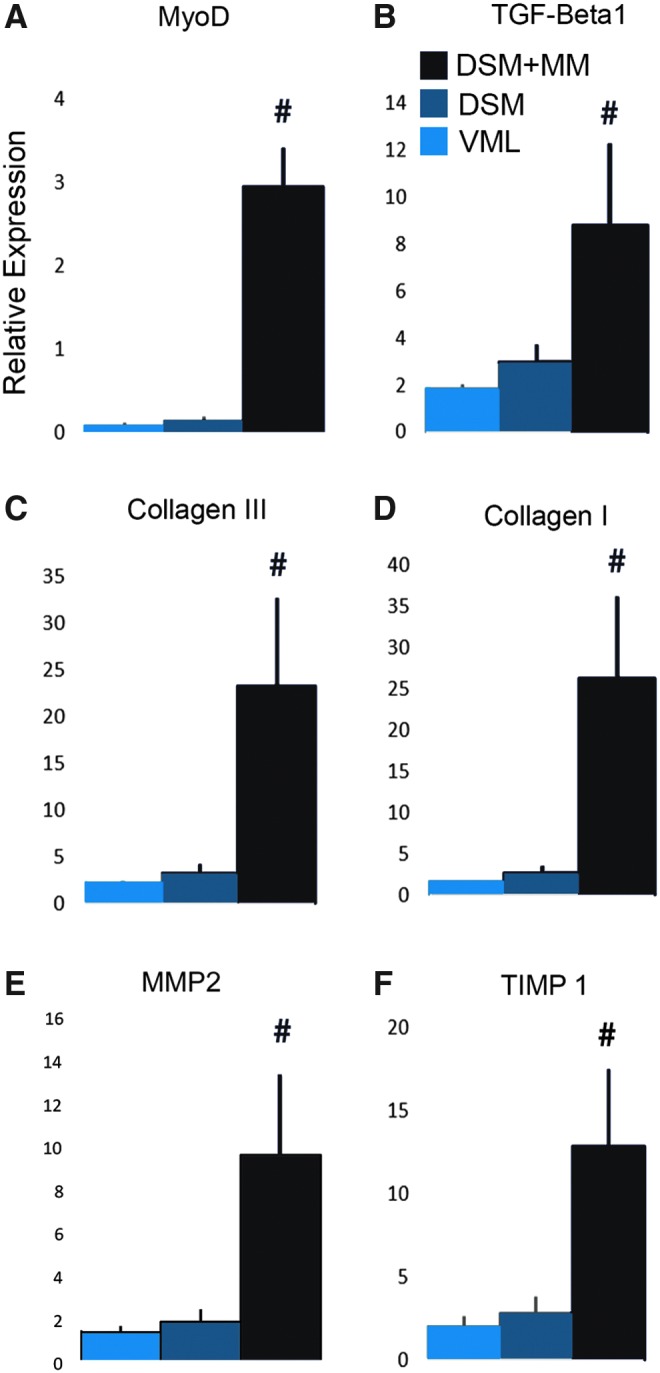
RT-PCR results (fold change compared to normal muscle) for the ECM structural proteins Collagen I and III, the ECM regulatory cytokines TGF-β1, MMP2, and TIMP-1, and the myogenic marker MyoD. Values shown are mean + SEM; n = 4/sample group; #distinguishes significant difference from both VML and DSM groups; p < 0.05; ANOVA with Tukey's test. SEM, standard error of the mean. Color images available online at www.liebertpub.com/tea