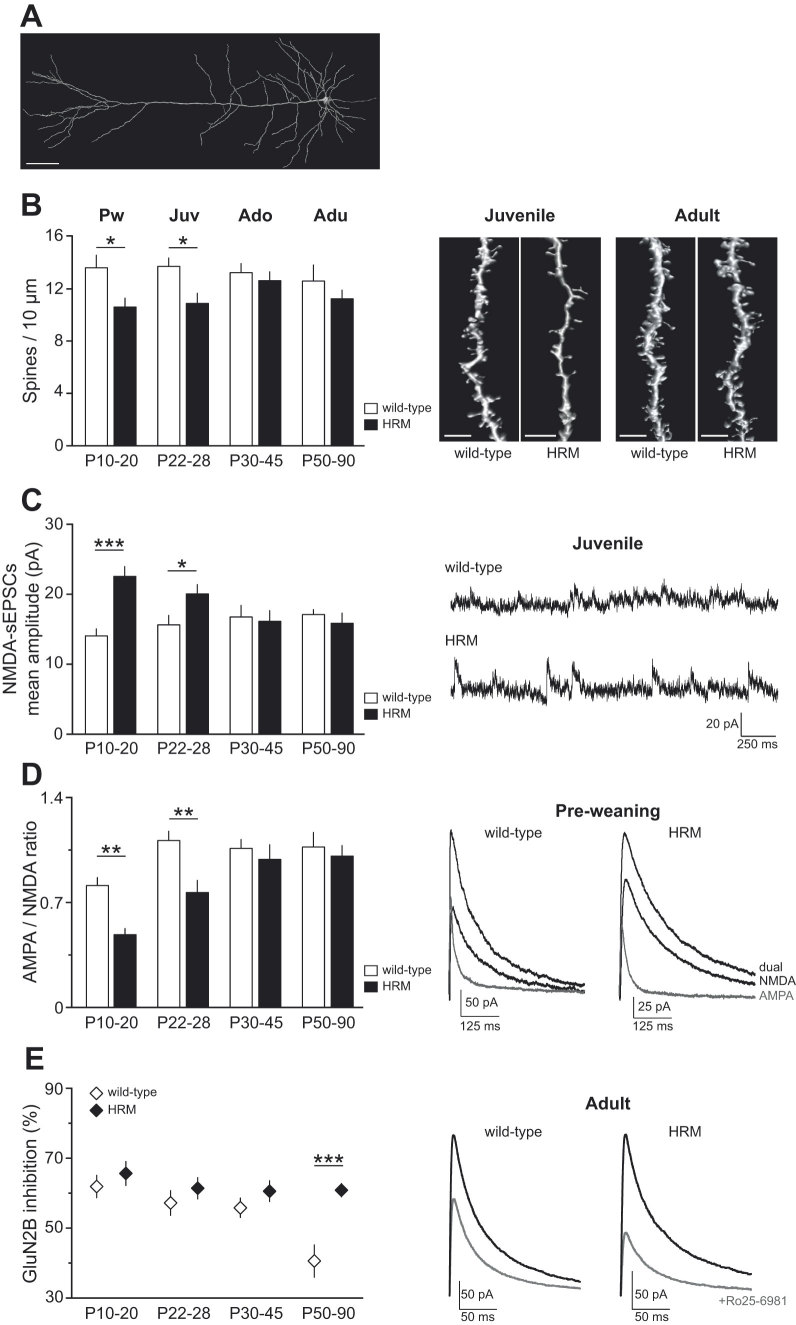
Figure 1. Reelin haploinsufficiency alters prefrontal dendritic spine density and synaptic glutamate receptor content.
(A) 3D reconstructed confocal image of layer 5 pyramidal PrPFC neuron filled with neurobiotin during whole-cell recording. Calibration: 50 μm. (B) Average spine density per 10 μm of oblique dendritic length of layer 5 PrPFC pyramidal neuron was reduced in HRM at P10-20 (10.6 ± 0.7, n = 13 HRM versus 13.6 ± 1.0, n = 10 wild-type) and P22-28 (10.9 ± 0.8, n = 15 HRM versus 13.7 ± 0.6, n = 9 wild-type). Spine densities were equivalent between both genotypes at adolescence and adulthood. Representative 3D volume rendering of reconstructed spines and shafts. Calibration: 5 μm. (C) Spontaneous NMDA-EPSCs mean amplitude was significantly increased to 22.6 ± 1.4 pA (n = 14) in P10-20 HRM and to 20.1 ± 1.3 pA (n = 11) in P22-28 HRM compared to age-matched wild-type (14.1 ± 1.0 pA, n = 15, P10-20 and 15.6 ± 1.4 pA, n = 12, P22-28). Representative NMDA-sEPSCs recorded at +40 mV in the presence of DNQX. (D) Mean AMPA/NMDA ratio was reduced in juvenile HRM at both P10-20 (0.49 ± 0.04, n = 10 HRM versus 0.81 ± 0.05, n = 12 wild-type) and P22-28 (0.77 ± 0.08, n = 8 in HRM versus 1.11 ± 0.06, n = 8 in wild-type). No differences were observed between both genotypes at older developmental stages. Representative evoked EPSCs recorded at +40 mV in control conditions (dual EPSCs) and in the presence of NBQX (10 μM; black). AMPA-EPSCs (gray) were obtained by digital subtraction of NMDA-EPSC from the dual EPSCs. (E) Ro25-6981-induced inhibition of evoked NMDA-EPSCs is represented as the percent decrease in peak current in the presence of Ro25-6981 (1 μM). The percentage of Ro25-6981 inhibition is equivalent in wild-type mice and HRM between P10 and P45 (P10-20: 61.9 ± 3.2%, n = 13 wild-type and 65.7 ± 3.4%, n = 14 HRM). At the adult stage, the Ro25-6981-sensitive fraction was lower in wild-type (40.6 ± 4.6%, n = 8) compared to HRM littermates (60.9 ± 1.9%, n = 9). Representative evoked NMDA-EPSC traces at +40 mV baseline (black) and in the presence of Ro25-6981 (grey). Error bars represent SEM and n is the number of neurons. *P < 0.05, **P < 0.001 and ***P < 0.001, one-way ANOVA.

