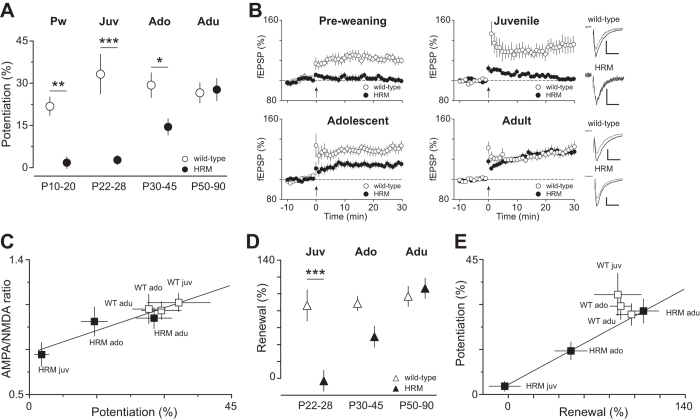
Figure 2. Reelin haploinsufficiency disrupts long-term potentiation and renewal of associative learning.
(A) Maturational profile of LTP. No potentiation was observed in HRM between P10-20 and P22-28 compared to age-matched wild-type (P10-20: 1.7 ± 2.1%, n = 12 HRM versus 21.8 ± 3.3% n = 8 wild-type; P22-28: 2.7 ± 1.7%, n = 18 HRM versus 33.2 ± 7.0%, n = 10 wild-type). LTP gradually increased in P30-45 HRM (14.5 ± 2.9%, n = 13) to reach values similar to wild-type at P50-90 (27.8 ± 4.0%, n = 16 HRM and 26.6 ± 3.6%, n = 18 wild-type). (B) Grouped time courses of fEPSP responses expressed as percentage of baseline before and after plasticity induction (indicated by arrow) in HRM and wild-type littermates are depicted for each developmental period. Right: Representative traces averaged from ten fEPSP responses before (gray) and 30 min after plasticity induction (black) taken from juvenile and adult mice. Calibration: 0.1 mV, 10 ms. (C) The coefficient of correlation between AMPA/NMDA ratio and the percentage of LTP is r2 = 0.8871 (P = 0.005) showing that the maturational changes in AMPA/NMDA ratio are tightly correlated to the degree of LTP. (D) Percentage of context-dependent renewal of fear response plotted against the age at which mice were conditioned. Renewal was similar at all ages in wild-type mice (Juv: 86.4 ± 18.5%, n = 15; Ado: 88.7 ± 8.6, n = 14; Adu: 97.1 ± 12.0%, n = 17) whereas in HRM, it gradually increased from -2.8 ± 12.4% (n = 21) in juvenile to 49.4 ± 12.7% (n = 16) in adolescent and reached values similar to wild-type at adult stage (106.6 ± 12.0%, n = 17). Data are the average of freezing response to the first 2 CS presentations during renewal normalized to the average of the last 2 CS presentations (CS 23-24) during extinction. (E) The correlation between percentage of renewal and magnitude of LTP during maturation is described by a linear fit with a slope of 0.9999 for HRM. Error bars represent SEM and n is the number of animals. *P < 0.05, **P < 0.001 and ***P < 0.001, one-way ANOVA.

