
Figure 3. Maturational profile of population differences based on optimal parameters combination.
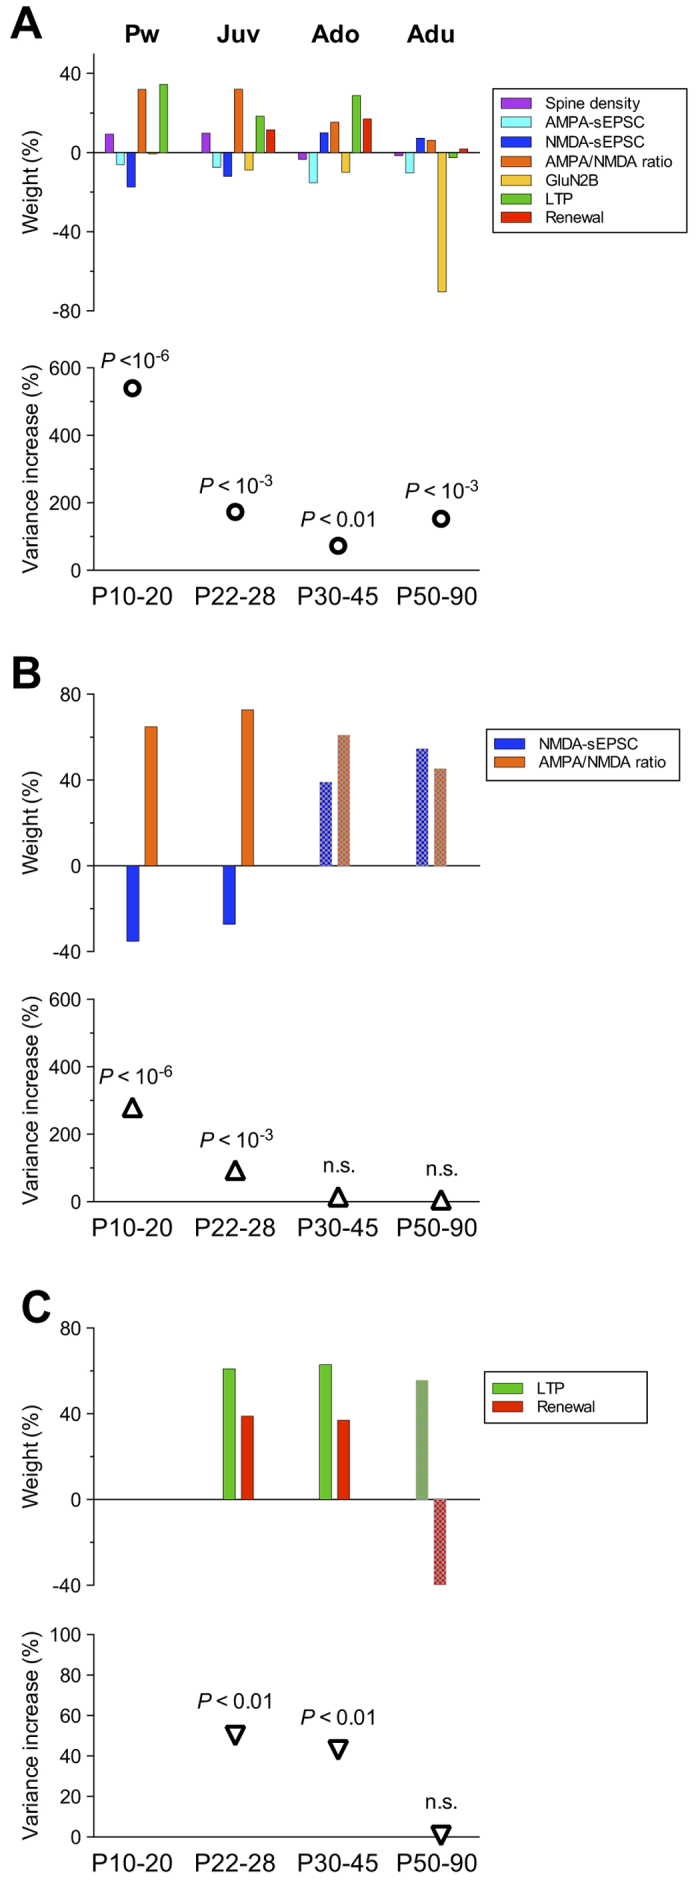
(A) The relative weight of measured parameters - spine density, AMPA- and NMDA-sEPSCs amplitude, AMPA/NMDA ratio, Ro25-6981 sensitivity of evoked NMDA-EPSCs (GluN2B), % of LTP and renewal - is shown within each developmental period. Note that the weights reflect the magnitude (absolute value) and direction (sign) of the differences between distributions showed in Supplementary Figure 3. The increase in the variance and the median P values of the optimized parameter was 540% and 4.1 × 10⁻⁹ at P10-20, 173% and 2.3 × 10⁻⁵ at P22-28, 73% and 1.1 × 10⁻³ at P30-45, 153% and 2.3 × 10⁻⁵ at P50-90. (B) Relative weight of NMDA-sEPSCs amplitude and AMPA/NMDA ratio during postnatal maturation. The variance increase of the optimized parameter combining the 2 parameters was strongly reduced from 280% at P10-20, 94% at P22-28 to 15% and 6% at P30-45 and P50-90. The median P values were 6 × 10⁻⁷ at P10-20, 4 × 10⁻⁴ at P22-28, 0.1 at P30-45 and 0.26 at P50-90. (C) Developmental time course of the relative weight of LTP and renewal. The variance increase of the optimized parameter combining LTP and renewal was 50% at P22-28, 43% at P30-45 and 0.7% at P50-90. Median P values were 5 × 10⁻³ at P22-28, 8 × 10⁻³ at P30-45 and 0.46 at P50-90. Shaded bars indicate when the variance increase of the optimized parameter does not reach significance.