
Figure 4. Effect of the NMDAR antagonist ketamine on the multivariate profile of juvenile reelin-haploinsufficient mice.
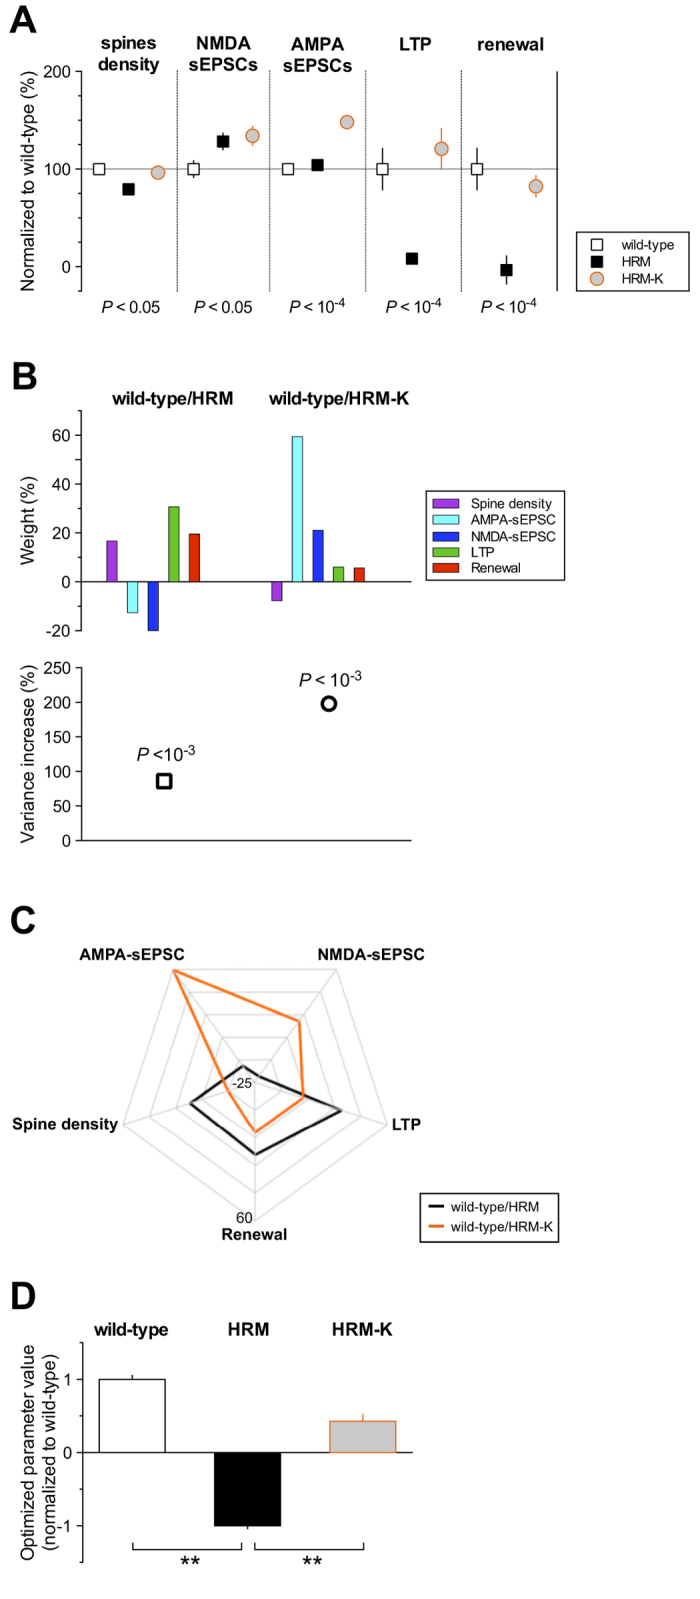
(A) Summary graph of multiscale measurements performed at P22-28 in wild-type, HRM and HRM injected with ketamine (HRM-K, 30-100 mg/kg). Each group of measure is expressed as a percentage ± SEM of the mean value obtained in wild-type mice. For each parameter, P values obtained with one-way ANOVA are indicated. Multiple comparisons showed that spine density, LTP and renewal were not different between wild-type and HRM-K, whereas NMDA-sEPSCs and AMPA-sEPSCs amplitudes were different in HRM treated with ketamine compared to wild-type mice. Note that measures presented for HRM-K are taken from datasets in ref 18. (B) The relative weight of each parameter is showed for wild-type versus HRM untreated (HRM) or versus ketamine-treated HRM (HRM-K). The increase in the variance and the median P values of the optimized parameter were: 86% and 6.5 × 10⁻⁴ for wild-type/HRM, 198% and 1.4 × 10⁻⁵ for wild-type/HRM-K. (C) Radar chart showing the divergence of relative weights (%) between wild-type versus HRM and wild-type versus ketamine-treated HRM. (D) Bar graph showing the optimized parameter value ± SD for each genotype and treatment normalized to the value obtained for wild-type mice. Optimized parameter value for each condition computed by applying the relative weights obtained from the MANOVA in untreated condition (b, upper left) on the multiscale measurements obtained for each genotype and treatment. The optimized parameter value was not different between wild-type and HRM injected with ketamine (HRM-K; P = 0.27, Student’s t-test). Wild-type and HRM-K optimized parameters were significantly different from HRM (P = 6.5 × 10⁻⁴ and P = 2.3 × 10⁻³ respectively, Student’s t-test).