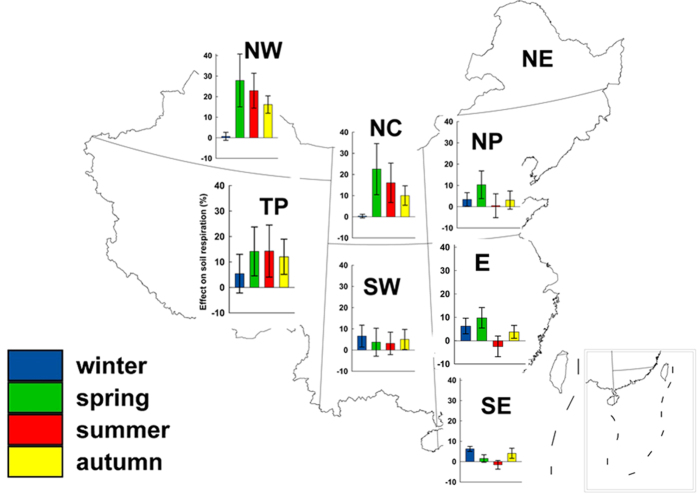
Figure 4. Effect of soil temperature change on soil respiration in four seasons and eight regions in China during 1962–2011.
Percentage change of soil respiration calculated using the average value of soil temperature at the 0.05–0.20 m soil layer. The error bars show ± one standard deviation. Map in this figure was generated though the ArcGIS 9.3 software provided Environmental Systems Research Institute (http://www.esri.com).

