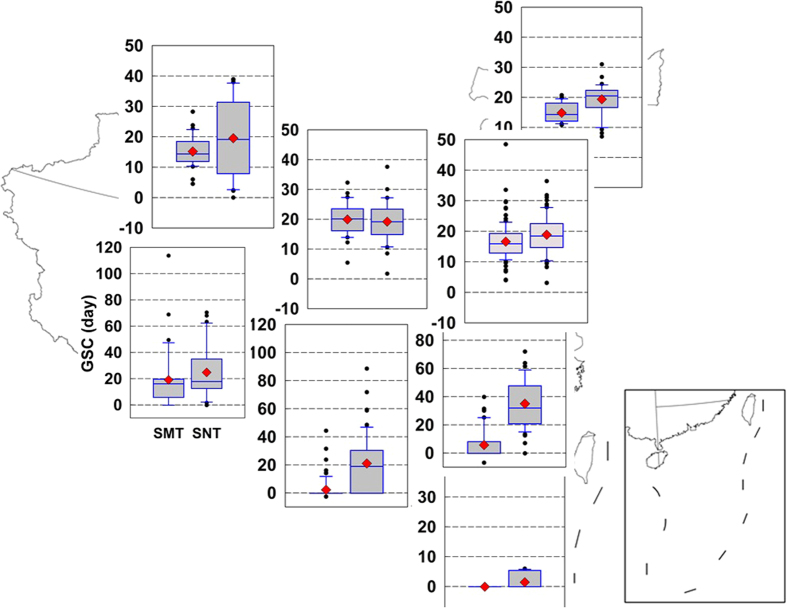
Figure 5. Effects of soil temperature change on durations of potential growing season and frost-free period in four seasons and eight regions in China (1962–2011).
Boxplots include the 10, 25, 50, 75, 90 percentiles of the change in duration of soil temperature above 0 °C, calculated from soil mean temperature (SMT) and soil minimum temperature (SNT) respectively. Red diamonds are average and dots are outliers. Map in this figure was generated though the ArcGIS 9.3 software provided Environmental Systems Research Institute (http://www.esri.com).

