Figure 4.
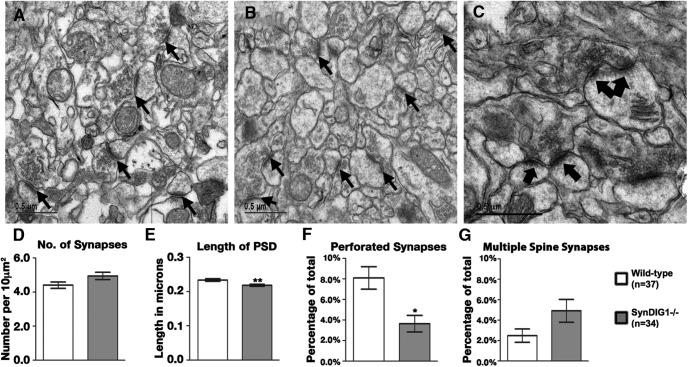
Synapse ultrastructure is altered in SynDIG1 mutant mice. A, B, Representative electron micrographs from the CA1 region of the hippocampus from P56 WT (A) and SynDIG1 β-gal homozygous mutant littermates (B). Example synapses are indicated by black arrows. C, Higher-magnification image from WT mouse hippocampus illustrating a stereotypical perforated synapse (conjoined black arrows) and multiple spine synapses (two separated arrows). Scale bar, 0.5 µm. D–G, Quantification of multiple images (WT, n = 37; SynDIG1 β-gal homozygous mutant, n = 34) reveal a trend toward increased synapse number (WT, 4.40 synapses/10 µm2; mutant, 4.94 synapses/10 μm2; p = 0.057; D), a statistically significant decrease in average PSD length (WT, 0.233 µm; SynDIG1 β-gal homozygous mutant, 0.218 µm; p = 0.016; E), a statistically significant decrease in the number of perforated synapses (WT, 8.10% perforated synapses; SynDIG1 β-gal homozygous mutant, 3.65% perforated synapses; p = 0.002; F), and a trend toward an increased number of multiple spine synapses (WT, 2.49% multiple spine synapses; SynDIG1 β-gal homozygous mutant, 4.92% multiple spine synapses; p = 0.059; G) in SynDIG1 β-gal homozygous mutant mice compared with WT. Error bars represent the SEM.

