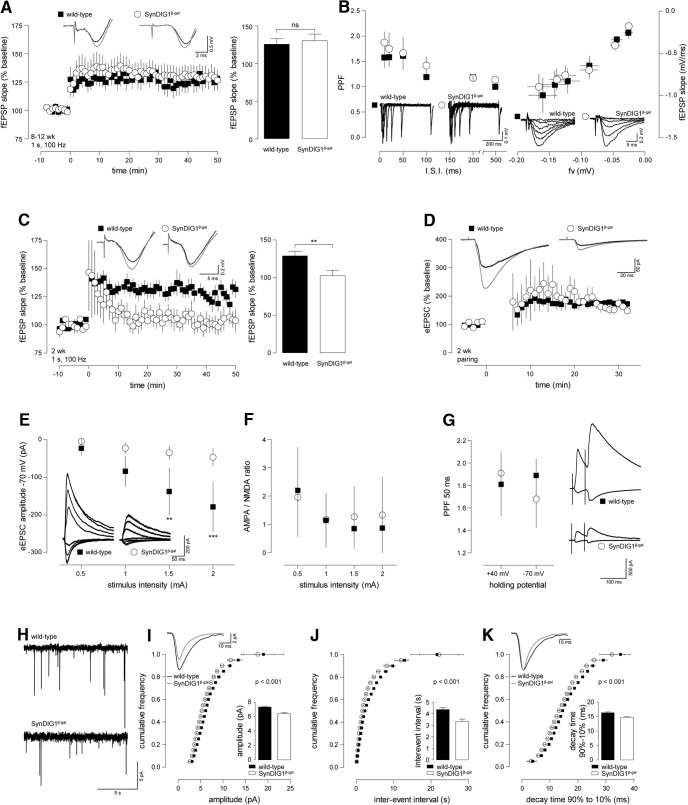
Figure 5.
Synaptic transmission and plasticity is disturbed in 2-week-old but not in adult SynDIG1 β-gal mutant mice. Acute brain slices from SynDIG1 β-gal homozygous mutant (○, SynDIG1 β-gal) and litter-matched WT controls (▪) were used to record Schaffer collateral LTP and whole-cell patch-clamp experiments on CA1 pyramidal cells. A, fEPSP recorded in slices from 8- to 12-week-old mice. SynDIG1 β-gal homozygous mutant and WT controls showed significant LTP after a 1 s 100 Hz tetanic stimulation. The level of potentiation was not different between the genotypes (WT: baseline, 99.6 ± 0.8%; LTP, 125.6 ± 7.6%; p < 0.05 vs baseline; n = 12; SynDIG1 β-gal homozygous mutant: baseline, 100.5 ± 0.4%; LTP, 130.2 ± 8.9%; p < 0.01 vs baseline; n = 13). Insets at top show traces from representative recordings before and after (gray traces) tetanization. The left panel shows averaged time courses of all experiments with traces from representative recordings on top. Statistics are illustrated in the bar diagram on the right. B, SynDIG1 β-gal homozygous mutant mice displayed normal PPF (left) and IOR (right) when compared with WT animals. Insets beneath data points show representative recordings. C, fEPSP recorded from 2-week-old mice. A 1 s 100 Hz tetanus leads to potentiation of fEPSP in WT [baseline, 99.9 ± 0.9%; LTP, 128.3 ± 6.7%; p < 0.001 (WT baseline vs LTP); n = 10] but not SynDIG1 β-gal homozygous mutant mice [baseline, 99.4 ± 0.5%; LTP, 102.6 ± 7.0%; p < 0.01 (SynDIG1 β-gal homozygous mutant vs WT LTP); n = 6]. The left panel shows the averaged time courses of all experiments with traces from representative recordings at the top. Statistics are illustrated in the bar diagram on the right. D, Pairing-induced LTP of evoked EPSC (eEPSC) in hippocampal slices of 2-week-old animals was normal in SynDIG1β-gal (baseline, 99.4 ± 0.6%; LTP, 168.5 ± 15.4%; p < 0.001 vs baseline; n = 3) compared with WT mice (baseline, 100.1 ± 0.04%; LTP, 175.7 ± 10.6%; p < 0.001 vs baseline; n = 4). Insets at the top show traces from representative recordings before and after (gray traces) pairing. E, EPSCs were evoked by increasing stimulus intensities recorded at holding potentials of −70 and +40 mV. At a holding potential of −40 mV, eEPSC amplitudes were significantly higher in WT mice than in SynDIG1β-gal mutants [stimulus intensity (si) = 0.5 mA, −22.8 ± 19.3 pA; si = 1 mA, −84.2 ± 40.1 pA; si = 1.5 mA, −137.9 ± 62.4 pA; si = 2 mA, −179.8 ± 66.6 pA; n = 9; SynDIG1β-gal; si = 0.5 mA, −4.7 ± 1.2 pA; si = 1 mA, −22.5 ± 15.6 pA; si = 1.5 mA, −34.6 ± 17.6 pA; si = 2 mA, −46.6 ± 23.1 pA; n = 4; two-way ANOVA and Bonferroni’s post-test: F(1,44) = 35.4; 1.5 pA, p < 0.01; 2 pA, p < 0.001]. Insets at the bottom show traces from representative recordings. F, The AMPAR/NMDAR ratio did not differ between WT and SynDIG1β-gal in the recordings from E for all stimulus intensities. G, No difference was found in PPF (50 ms interstimulus interval) between WT and SynDIG1β-gal. Insets on the right show traces from representative recordings. H, Sample recordings of mEPSCs recorded from CA1 pyramidal neurons in acute slices of 2-week-old WT and SynDIG1 β-gal homozygous mutant mice. I–K, Cumulative histograms show significant reduction in amplitude (I), interevent interval (J), and decay time (K) of mEPSC recorded in SynDIG1 β-gal homozygous mutant compared with WT mice (bin size, 0.5; t tests for each binned data point). Inset at top contains traces averaged from all mEPSCs of one representative experiment for each genotype drawn to scale (I) and normalized to peak (K). Averages are shown in bar diagrams at the bottom (amplitude: WT, 7.3 ± 0.1 pA, n = 8; SynDIG1 β-gal homozygous mutant, 6.4 ± 0.1 pA, n = 6. Interevent interval: WT, 4.3 ± 0.2 s; SynDIG1 β-gal homozygous mutant, 3.3 ± 0.2 ms. Decay time: WT, 16.4 ± 0.3 ms; SynDIG1 β-gal homozygous mutant, 14.7 ± 0.3 ms).

